HOT TOPICS LIST
- MACD
- Fibonacci
- RSI
- Gann
- ADXR
- Stochastics
- Volume
- Triangles
- Futures
- Cycles
- Volatility
- ZIGZAG
- MESA
- Retracement
- Aroon
INDICATORS LIST
LIST OF TOPICS
PRINT THIS ARTICLE
by Arthur Hill
After becoming oversold and forming a bullish engulfing pattern, the US Dollar Index looks poised for a bounce. Don't get too excited, though.
Position: Hold
Arthur Hill
Arthur Hill is currently editor of TDTrader.com, a website specializing in trading strategies, sector/industry specific breadth stats and overall technical analysis. He passed the Society of Technical Analysts (STA London) diploma exam with distinction is a Certified Financial Technician (CFTe). Prior to TD Trader, he was the Chief Technical Analyst for Stockcharts.com and the main contributor to the ChartSchool.
PRINT THIS ARTICLE
OVERBOUGHT OVERSOLD
US Dollar Index Tries To Firm
10/24/07 09:55:52 AMby Arthur Hill
After becoming oversold and forming a bullish engulfing pattern, the US Dollar Index looks poised for a bounce. Don't get too excited, though.
Position: Hold
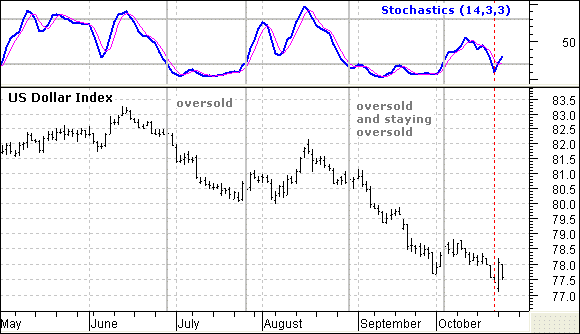
| The US Dollar Index ($USD) is clearly in a downtrend and trading at multiyear lows. With the latest decline over the last two months, the index again became oversold as the stochastic oscillator dipped below 20 last week (red dotted line). The stochastic oscillator was below 20 most of July and all of September. This shows how a security can become oversold and remain oversold as the downtrend continues. See Figure 1. |

|
| FIGURE 1: US DOLLAR INDEX. $USD is clearly in a downtrend. |
| Graphic provided by: MetaStock. |
| |
| The July and September oversold readings lasted over four weeks, but the index quickly bounced back after last week's oversold reading. The ability to move back above 20 suggests that the downtrend may be exhausting itself and the index could be poised for an oversold bounce. |

|
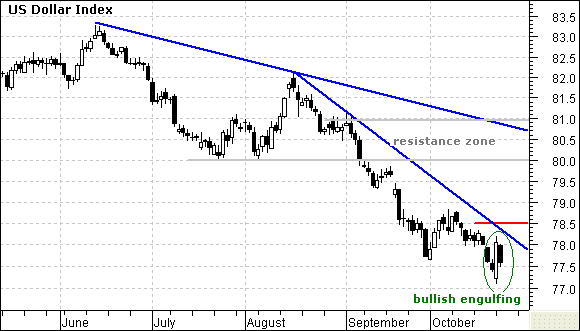
| FIGURE 2: US DOLLAR INDEX. The index shows some signs of firmness lately, however. |
| Graphic provided by: MetaStock. |
| |
| The index also shows some signs of firmness with a bullish engulfing pattern. This pattern forms when the open is below the prior low and the close is above the prior high. The long white candlestick completely engulfs the prior candlestick and this intraday reversal shows buying pressure. These patterns require confirmation, and a move above 78.5 would provide confirmation. This would also break the mid-August trendline. |
| While such a breakout would be short-term bullish, traders should not expect more than an oversold bounce. I am marking a resistance zone around 80–81 and this is the upside target. Resistance here stems from the June trendline, broken support, and the early September high. |
Arthur Hill is currently editor of TDTrader.com, a website specializing in trading strategies, sector/industry specific breadth stats and overall technical analysis. He passed the Society of Technical Analysts (STA London) diploma exam with distinction is a Certified Financial Technician (CFTe). Prior to TD Trader, he was the Chief Technical Analyst for Stockcharts.com and the main contributor to the ChartSchool.
| Title: | Editor |
| Company: | TDTrader.com |
| Address: | Willem Geetsstraat 17 |
| Mechelen, B2800 | |
| Phone # for sales: | 3215345465 |
| Website: | www.tdtrader.com |
| E-mail address: | arthurh@tdtrader.com |
Traders' Resource Links | |
| TDTrader.com has not added any product or service information to TRADERS' RESOURCE. | |
Click here for more information about our publications!
Comments

Request Information From Our Sponsors
- StockCharts.com, Inc.
- Candle Patterns
- Candlestick Charting Explained
- Intermarket Technical Analysis
- John Murphy on Chart Analysis
- John Murphy's Chart Pattern Recognition
- John Murphy's Market Message
- MurphyExplainsMarketAnalysis-Intermarket Analysis
- MurphyExplainsMarketAnalysis-Visual Analysis
- StockCharts.com
- Technical Analysis of the Financial Markets
- The Visual Investor
- VectorVest, Inc.
- Executive Premier Workshop
- One-Day Options Course
- OptionsPro
- Retirement Income Workshop
- Sure-Fire Trading Systems (VectorVest, Inc.)
- Trading as a Business Workshop
- VectorVest 7 EOD
- VectorVest 7 RealTime/IntraDay
- VectorVest AutoTester
- VectorVest Educational Services
- VectorVest OnLine
- VectorVest Options Analyzer
- VectorVest ProGraphics v6.0
- VectorVest ProTrader 7
- VectorVest RealTime Derby Tool
- VectorVest Simulator
- VectorVest Variator
- VectorVest Watchdog
