HOT TOPICS LIST
- MACD
- Fibonacci
- RSI
- Gann
- ADXR
- Stochastics
- Volume
- Triangles
- Futures
- Cycles
- Volatility
- ZIGZAG
- MESA
- Retracement
- Aroon
INDICATORS LIST
LIST OF TOPICS
PRINT THIS ARTICLE
by David Penn
Negative divergences in the MACD histogram and stochastic support potential for correction in the yellow metal.
Position: N/A
David Penn
Technical Writer for Technical Analysis of STOCKS & COMMODITIES magazine, Working-Money.com, and Traders.com Advantage.
PRINT THIS ARTICLE
CANDLESTICK CHARTING
Evening Star In December Gold Awaits Bearish Confirmation
10/24/07 09:38:18 AMby David Penn
Negative divergences in the MACD histogram and stochastic support potential for correction in the yellow metal.
Position: N/A
| My last discussion about gold in Traders.com suggested that the market was shaping up technically to establish a bottom ("A 2B Bottom In December Gold?", September 5, 2007). At the time, December gold was trading at approximately 676.20 and had just rallied from a test of its June lows. |
| With the benefit of a bullish technical portrait and favorable seasonal tendencies (both discussed in that article), gold advanced strongly out of August, through September, and into October. |

|
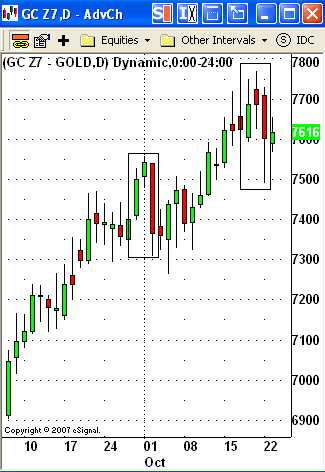
| FIGURE 1: GOLD, DECEMBER FUTURES, DAILY. The lack of downside follow-through prevented a short sale in December gold in earliest October following a previous evening star pattern. |
| Graphic provided by: eSignal. |
| |
| The first sign of trouble appeared in late September as a breakout from a short-term consolidation led to an evening star pattern between the final trading days of September and the first trading days of October (Figure 1). This evening star pattern, however, did not yield any significant follow-through to the downside on a closing basis. This negated much of the bearishness of the symbol — and all but eliminated its validity as a sell signal. Sure enough, within seven days after the evening star pattern appeared, December gold was making new contract highs. |

|
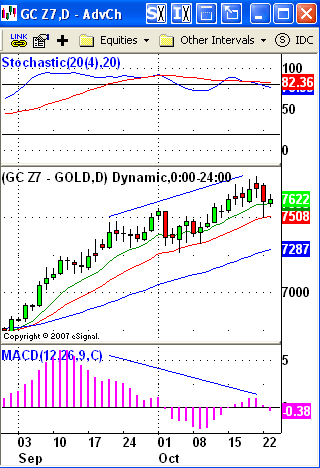
| GOLD, DECEMBER FUTURES, DAILY. Negative divergences in both the stochastic and the MACD histogram helped confirm the bearish potential of the evening star pattern in the second half of October. |
| Graphic provided by: eSignal. |
| |
| Key technical indicators — in this case, both the stochastic and the MACD histogram — confirmed both the older evening star and the more recent one that has appeared in late October (Figure 2). What prevented — or should have prevented — traders from making bets against the gold market in the case of the former evening star was the lack of a confirming close below the low of the pattern. |
| The fact that the current divergences with the late October evening star are all the more pronounced than the previous ones does make it somewhat more likely that the late October evening star will result in a more significant correction. However, until the market for December gold makes a confirming close below the low of the evening star pattern (a low at approximately 749), gold bears would probably do well to wait before trying to take head on what has been a strong rally from the August lows. |
Technical Writer for Technical Analysis of STOCKS & COMMODITIES magazine, Working-Money.com, and Traders.com Advantage.
| Title: | Technical Writer |
| Company: | Technical Analysis, Inc. |
| Address: | 4757 California Avenue SW |
| Seattle, WA 98116 | |
| Phone # for sales: | 206 938 0570 |
| Fax: | 206 938 1307 |
| Website: | www.Traders.com |
| E-mail address: | DPenn@traders.com |
Traders' Resource Links | |
| Charting the Stock Market: The Wyckoff Method -- Books | |
| Working-Money.com -- Online Trading Services | |
| Traders.com Advantage -- Online Trading Services | |
| Technical Analysis of Stocks & Commodities -- Publications and Newsletters | |
| Working Money, at Working-Money.com -- Publications and Newsletters | |
| Traders.com Advantage -- Publications and Newsletters | |
| Professional Traders Starter Kit -- Software | |
Click here for more information about our publications!
Comments

Request Information From Our Sponsors
- StockCharts.com, Inc.
- Candle Patterns
- Candlestick Charting Explained
- Intermarket Technical Analysis
- John Murphy on Chart Analysis
- John Murphy's Chart Pattern Recognition
- John Murphy's Market Message
- MurphyExplainsMarketAnalysis-Intermarket Analysis
- MurphyExplainsMarketAnalysis-Visual Analysis
- StockCharts.com
- Technical Analysis of the Financial Markets
- The Visual Investor
- VectorVest, Inc.
- Executive Premier Workshop
- One-Day Options Course
- OptionsPro
- Retirement Income Workshop
- Sure-Fire Trading Systems (VectorVest, Inc.)
- Trading as a Business Workshop
- VectorVest 7 EOD
- VectorVest 7 RealTime/IntraDay
- VectorVest AutoTester
- VectorVest Educational Services
- VectorVest OnLine
- VectorVest Options Analyzer
- VectorVest ProGraphics v6.0
- VectorVest ProTrader 7
- VectorVest RealTime Derby Tool
- VectorVest Simulator
- VectorVest Variator
- VectorVest Watchdog
