HOT TOPICS LIST
- MACD
- Fibonacci
- RSI
- Gann
- ADXR
- Stochastics
- Volume
- Triangles
- Futures
- Cycles
- Volatility
- ZIGZAG
- MESA
- Retracement
- Aroon
INDICATORS LIST
LIST OF TOPICS
PRINT THIS ARTICLE
by David Penn
A few days after an ascending triangle hinted at higher prices, sellers took the USD/JPY down hard. Here's how it happened.
Position: N/A
David Penn
Technical Writer for Technical Analysis of STOCKS & COMMODITIES magazine, Working-Money.com, and Traders.com Advantage.
PRINT THIS ARTICLE
TRADING SYSTEMS
Dollar Down Against The Yen: Revisiting The Ascending Triangle In USD/JPY
10/23/07 01:23:47 PMby David Penn
A few days after an ascending triangle hinted at higher prices, sellers took the USD/JPY down hard. Here's how it happened.
Position: N/A
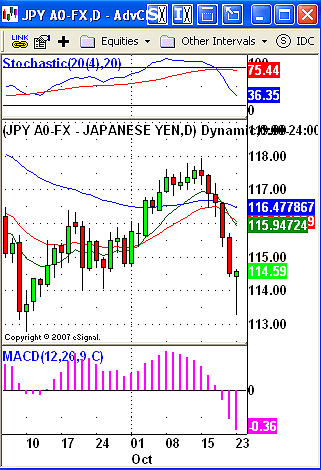
| With the pullback in the USD/JPY's ascending triangle turning into a plunge, I thought it would be a good idea to go back and look at that market and see when traders could have spotted the weakness in the USD/JPY — weakness that turned a potential breakout into a nasty breakdown. |
| The buy signal in USD/JPY, for my money, was on October 3 when the market for USD/JPY broke out above the highs of September to close at 116.79. I like to wait for confirming closes whenever possible, which means waiting for a close above the high of the October 3rd session (a high of 116.79). This confirming close came two days later on October 5 with a close of 116.92. I should point out that this confirming close was also good for a BOSO (stochastic breakout) long signal that developed on October 4. That signal required a close above the October 4th high of 116.77. (See Figure 1.) |
| So either way, we are long at 116.92 as of the end of day on October 5. The market for USD/JPY moved up gradually after that point. By October 15, USD/JPY made an intraday high of 117.95. Generally, I've taken profits once a market gives me 100 pips. At a minimum, moving stops to breakeven once this or a similar milestone is reached can help traders avoid watching trades go from winners to losers. |

|
| FIGURE 1: US DOLLAR/JAPANESE YEN, DAILY. A breakout in early October was confirmed by a BOSO long signal when the stochastic crossed above 80. But selling toward mid-October likely forced traders out — or short — before the USD/JPY long trade could clear the 118 level. |
| Graphic provided by: eSignal. |
| |
| By the time I wrote my recent article about the USD/JPY pair, the market had already thrown up some warning signs for those who were long. These warning signs were largely in the form of lower lows on three consecutive sessions (October 15, 16, and 17). A trader minding his or her breakeven stop after the market hit the 100+ pip level would have exited at this point. But even if he or she had stayed on, the close below the 50-day exponential moving average on October 17 should have chased all but the most obstinate traders out of their long positions. In part, this is because I view a close beneath the 50-day EMA to be a sell signal if succeeded by a confirming close to the downside — which in fact arrived on October 18. |
| At this point, with the confirming close on October 18, not only should traders not have been long, but they also could have reasonably gone short. The confirming close in the wake of the sub–50 day EMA close came at 115.57 on October 18. By the end of the following session on Friday, October 19, the USD/JPY had fallen the requisite 100+ points for profit-taking and/or breakeven stop placement. |
Technical Writer for Technical Analysis of STOCKS & COMMODITIES magazine, Working-Money.com, and Traders.com Advantage.
| Title: | Technical Writer |
| Company: | Technical Analysis, Inc. |
| Address: | 4757 California Avenue SW |
| Seattle, WA 98116 | |
| Phone # for sales: | 206 938 0570 |
| Fax: | 206 938 1307 |
| Website: | www.Traders.com |
| E-mail address: | DPenn@traders.com |
Traders' Resource Links | |
| Charting the Stock Market: The Wyckoff Method -- Books | |
| Working-Money.com -- Online Trading Services | |
| Traders.com Advantage -- Online Trading Services | |
| Technical Analysis of Stocks & Commodities -- Publications and Newsletters | |
| Working Money, at Working-Money.com -- Publications and Newsletters | |
| Traders.com Advantage -- Publications and Newsletters | |
| Professional Traders Starter Kit -- Software | |
Click here for more information about our publications!
PRINT THIS ARTICLE

Request Information From Our Sponsors
- StockCharts.com, Inc.
- Candle Patterns
- Candlestick Charting Explained
- Intermarket Technical Analysis
- John Murphy on Chart Analysis
- John Murphy's Chart Pattern Recognition
- John Murphy's Market Message
- MurphyExplainsMarketAnalysis-Intermarket Analysis
- MurphyExplainsMarketAnalysis-Visual Analysis
- StockCharts.com
- Technical Analysis of the Financial Markets
- The Visual Investor
- VectorVest, Inc.
- Executive Premier Workshop
- One-Day Options Course
- OptionsPro
- Retirement Income Workshop
- Sure-Fire Trading Systems (VectorVest, Inc.)
- Trading as a Business Workshop
- VectorVest 7 EOD
- VectorVest 7 RealTime/IntraDay
- VectorVest AutoTester
- VectorVest Educational Services
- VectorVest OnLine
- VectorVest Options Analyzer
- VectorVest ProGraphics v6.0
- VectorVest ProTrader 7
- VectorVest RealTime Derby Tool
- VectorVest Simulator
- VectorVest Variator
- VectorVest Watchdog
