HOT TOPICS LIST
- MACD
- Fibonacci
- RSI
- Gann
- ADXR
- Stochastics
- Volume
- Triangles
- Futures
- Cycles
- Volatility
- ZIGZAG
- MESA
- Retracement
- Aroon
INDICATORS LIST
LIST OF TOPICS
PRINT THIS ARTICLE
by Gary Grosschadl
Boeing Co. has given investors a nice double in stock price in two and a half years, but now a serious challenge comes into view.
Position: Hold
Gary Grosschadl
Independent Canadian equities trader and technical analyst based in Peterborough
Ontario, Canada.
PRINT THIS ARTICLE
DOUBLE TOPS
Are Boeing's High-Flying Days Topped Out?
10/24/07 09:46:50 AMby Gary Grosschadl
Boeing Co. has given investors a nice double in stock price in two and a half years, but now a serious challenge comes into view.
Position: Hold
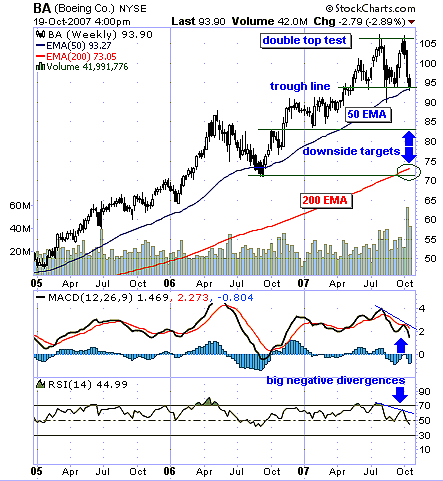
| As this multiyear weekly chart shows, Boeing has had an impeccable run since 2005 (Figure 1). Note how in that time its most relevant moving average line of support has been the 50-period exponential moving average (EMA). Currently, that line, the important level of support, is being tested for the third time. |
| This test takes the form of a potential double-top test. The symmetry of the pattern looks good, with the trough area midway between the peaks. Should this important level of support fail, two downside targets should be considered, the first being the pattern completion target of the $83 area, which encompasses the height of the double peak from the trendline applied to a possible downside move below that trendline. Should that support fail, the next obvious area is the ever-important 200-day period EMA (currently $73) and a strong area of previous support near $70. |

|
| FIGURE 1: BOEING, WEEKLY. BA's weekly chart suggests a double-top test is under way. |
| Graphic provided by: StockCharts.com. |
| |
| Boeing's blue skies are potentially darkened by two displayed indicators below the chart. Both the moving average convergence/divergence (MACD) and the relative strength indicator (RSI) show large negative divergences. When a stock shows important indicators as these going in the opposite direction of the stock price, a downside change may be evolving. In addition, note the large volume spike nearing 65 million shares from a recent week, lending credence to the idea that investors are starting to bail. |
| Watch for a close below $93, signaling the fruition of a double top moving toward downside targets. On the other hand, support here at the trendline could spell another surge north to test the $105 top area. These important lines of support discussed should chart the next course correction for this company. |
Independent Canadian equities trader and technical analyst based in Peterborough
Ontario, Canada.
| Website: | www.whatsonsale.ca/financial.html |
| E-mail address: | gwg7@sympatico.ca |
Click here for more information about our publications!
PRINT THIS ARTICLE

Request Information From Our Sponsors
- StockCharts.com, Inc.
- Candle Patterns
- Candlestick Charting Explained
- Intermarket Technical Analysis
- John Murphy on Chart Analysis
- John Murphy's Chart Pattern Recognition
- John Murphy's Market Message
- MurphyExplainsMarketAnalysis-Intermarket Analysis
- MurphyExplainsMarketAnalysis-Visual Analysis
- StockCharts.com
- Technical Analysis of the Financial Markets
- The Visual Investor
- VectorVest, Inc.
- Executive Premier Workshop
- One-Day Options Course
- OptionsPro
- Retirement Income Workshop
- Sure-Fire Trading Systems (VectorVest, Inc.)
- Trading as a Business Workshop
- VectorVest 7 EOD
- VectorVest 7 RealTime/IntraDay
- VectorVest AutoTester
- VectorVest Educational Services
- VectorVest OnLine
- VectorVest Options Analyzer
- VectorVest ProGraphics v6.0
- VectorVest ProTrader 7
- VectorVest RealTime Derby Tool
- VectorVest Simulator
- VectorVest Variator
- VectorVest Watchdog
