HOT TOPICS LIST
- MACD
- Fibonacci
- RSI
- Gann
- ADXR
- Stochastics
- Volume
- Triangles
- Futures
- Cycles
- Volatility
- ZIGZAG
- MESA
- Retracement
- Aroon
INDICATORS LIST
LIST OF TOPICS
PRINT THIS ARTICLE
by Gary Grosschadl
The year 2007 will be remembered by Canadian traders for two main events. First, this year the TSX rose above the DJIA for the first time (currently at 14,332 vs. Dow 13,888). In addition, the loonie started trading higher than the US dollar, which is really a function of the weak US currency.
Position: Accumulate
Gary Grosschadl
Independent Canadian equities trader and technical analyst based in Peterborough
Ontario, Canada.
PRINT THIS ARTICLE
ANDREWS PITCH-FORK
The TSX Energy Index Still Gushing Higher
10/23/07 01:40:00 PMby Gary Grosschadl
The year 2007 will be remembered by Canadian traders for two main events. First, this year the TSX rose above the DJIA for the first time (currently at 14,332 vs. Dow 13,888). In addition, the loonie started trading higher than the US dollar, which is really a function of the weak US currency.
Position: Accumulate
| In part, what helped drive Canadian markets above their US counterpart is the heavier weighting of the oil and gas sector. With oil trading above $85, we can see this additive effect on the TSX and its energy index. How much longer will this continue? |
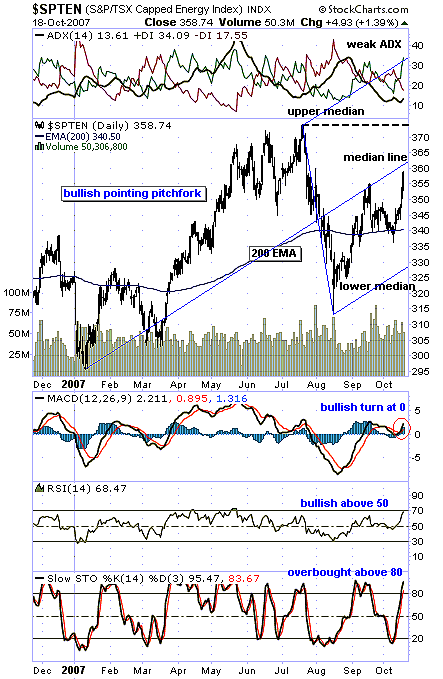
| Figure 1 shows a bullish pointing pitchfork indicating further strength for energy indexes likely on both sides of the border. This pitchfork tool, or Andrews line method, named after the originator, Alan Andrews, shows an alternative method of plotting support and resistance. With this method, three turning points are chosen (in this case, low, high, low) and then the charting software automatically plots the median lines representing likely support and resistance levels. One of the rules of pitchfork theory maintains that a move off either the upper median line or the lower median line eventually reaches the center median line. What transpires then is either a move down to test lower support or a bold thrust through the median line. In this example we see a perfect move to the median line in September and then a move to test support at the 200-day EMA. Remember that the pitchfork is plotted without the benefit of that first median line touch. Had this failed, then the next major support was the lower median line. Now we are approaching another test of the center median line. |

|
| FIGURE 1: TSX ENERGY INDEX, DAILY. The energy index is still poised on an upward track. |
| Graphic provided by: StockCharts.com. |
| |
| The four indicators displayed are a mixed bag of sentiment. At the top of the chart, the average directional movement index (ADX) line is weak at 13.61. Typically, an ADX of 20 or higher shows a strong trend in place. Should the ADX swing up from here, bullish trend strength is indicated. Below the chart the moving average convergence/divergence (MACD) shows a bullish turn at the zero-line. This hints at a continuing upleg. The relative strength index (RSI) shows bullish strength above the 50 zone; however, things tend to be toppy at 70. Note the large rise from April to July while the RSI gyrated between 50 and 70. Finally, the stochastic oscillator reminds us that we are in overbought territory above the 80 mark. This is a cautionary note to be watchful of a correcting downleg. |
| As long as the lower median line is not breached, bullishness prevails in this pitchfork view. More conservatively, I would like to see the 200-day EMA hold support. The super-bullish view would entail a bold move above the center median line. A close above that line entertains the possibility of an eventual move to the upper median line. Can anyone say $100 a barrel of oil? More than a year or so ago, I first posted an oil chart that suggested $50 a barrel of oil was a possibility. At that time that was a bit of a stretch. |
Independent Canadian equities trader and technical analyst based in Peterborough
Ontario, Canada.
| Website: | www.whatsonsale.ca/financial.html |
| E-mail address: | gwg7@sympatico.ca |
Click here for more information about our publications!
PRINT THIS ARTICLE

Request Information From Our Sponsors
- StockCharts.com, Inc.
- Candle Patterns
- Candlestick Charting Explained
- Intermarket Technical Analysis
- John Murphy on Chart Analysis
- John Murphy's Chart Pattern Recognition
- John Murphy's Market Message
- MurphyExplainsMarketAnalysis-Intermarket Analysis
- MurphyExplainsMarketAnalysis-Visual Analysis
- StockCharts.com
- Technical Analysis of the Financial Markets
- The Visual Investor
- VectorVest, Inc.
- Executive Premier Workshop
- One-Day Options Course
- OptionsPro
- Retirement Income Workshop
- Sure-Fire Trading Systems (VectorVest, Inc.)
- Trading as a Business Workshop
- VectorVest 7 EOD
- VectorVest 7 RealTime/IntraDay
- VectorVest AutoTester
- VectorVest Educational Services
- VectorVest OnLine
- VectorVest Options Analyzer
- VectorVest ProGraphics v6.0
- VectorVest ProTrader 7
- VectorVest RealTime Derby Tool
- VectorVest Simulator
- VectorVest Variator
- VectorVest Watchdog
