HOT TOPICS LIST
- MACD
- Fibonacci
- RSI
- Gann
- ADXR
- Stochastics
- Volume
- Triangles
- Futures
- Cycles
- Volatility
- ZIGZAG
- MESA
- Retracement
- Aroon
INDICATORS LIST
LIST OF TOPICS
PRINT THIS ARTICLE
by Koos van der Merwe
Is this a company loved by its customers, or is it well managed?
Position: Accumulate
Koos van der Merwe
Has been a technical analyst since 1969, and has worked as a futures and options trader with First Financial Futures in Johannesburg, South Africa.
PRINT THIS ARTICLE
TREND-CHANNEL
A Lulu Of An IPO
10/23/07 08:20:23 AMby Koos van der Merwe
Is this a company loved by its customers, or is it well managed?
Position: Accumulate
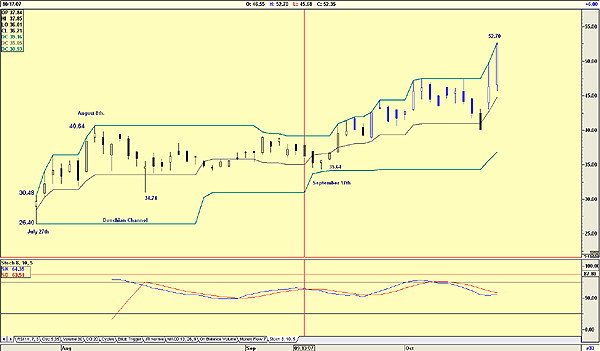
| The LULU I am referring to is Lululemon (LLL.TO), listed on the Toronto Stock Exchange. The company was founded in Vancouver, Canada, and was listed on the Toronto stock exchange on July 27, 2007, after a very successful IPO pitched in the United States. The low of that day was $26.40, with the high at $30.48, closing at $29.72. The following day, after the price reached a high of $34.10, one of Canada's top portfolio managers stated on TV that the stock was overpriced, and holders should sell. She should have known better. She forgot that the majority of Lululemon's clientele are women. Female instinct also transcends the intellect of any market guru. The price soared far beyond her sell level. |

|
| FIGURE 1: LULULEMON. Here's an IPO defying gravity. |
| Graphic provided by: AdvancedGET. |
| |
| When the price reached $40.64 on August 8, many investors must have said thank-you for the profit and cashed in their shares, concluding with a Thank-you, Lululemon, you have given me all the yoga outfits I bought from you over the years at no charge. As you can see in the chart (Figure 1), rather than fall dramatically to the bottom line of the Donchian channel, the price found support on the Donchian channel midpoint and continued moving sideways until September 17, when it tested the Donchian channel low that had moved up with a candlestick hammer pattern showing a low of $35.64. From that low point, the price simply moved up strongly to the high of $52.70, shown on the chart. At this time of writing, Lululemon is trading at $54.56. The stochastic oscillator shown is suggesting a sell signal at these prices, but ladies, would you sell that 100 shares you own on some broker's recommendation? No way. Feminine intuition is the name of the game here, not the fundamental worth of the company. Joking aside, what does my chart say for the future? To answer this question I refer to Figure 2. |

|
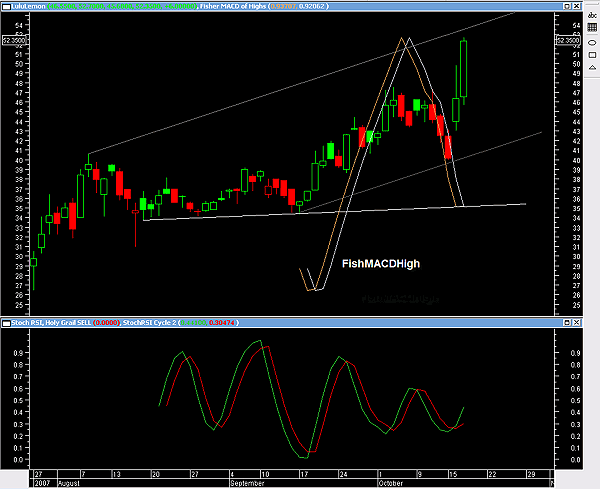
| FIGURE 2: LULULEMON. A stock price defying all analysis. |
| Graphic provided by: MetaStock. |
| |
| My indicators of choice are the Fisher transform of the MACD of the high, and a stochastic RSI with a parameter of 7 (Figure 2). The FishMACDHigh indicator is suggesting weakness and moving down, in spite of the increase in the stock price. The stochastic RSI has given a buy signal at the current price, a little late. With these two indicators in doubt, I can only accept the trendline as the main support and resistance levels. |
| So would you buy the stock at the present price? I would not, with the price testing the upper resistance line. I would wait for a pullback, but when I think about it, I was wrong in advising my clients to sell when the stock price was $38. I suggest that you ask any woman who buys her yoga outfits at Lululemon for her opinion and go with that. Sometimes that gut feel, especially if it is feminine, is better than any technical or fundamental analysis. Lululemon is one strong lulu. |
Has been a technical analyst since 1969, and has worked as a futures and options trader with First Financial Futures in Johannesburg, South Africa.
| Address: | 3256 West 24th Ave |
| Vancouver, BC | |
| Phone # for sales: | 6042634214 |
| E-mail address: | petroosp@gmail.com |
Click here for more information about our publications!
PRINT THIS ARTICLE

Request Information From Our Sponsors
- StockCharts.com, Inc.
- Candle Patterns
- Candlestick Charting Explained
- Intermarket Technical Analysis
- John Murphy on Chart Analysis
- John Murphy's Chart Pattern Recognition
- John Murphy's Market Message
- MurphyExplainsMarketAnalysis-Intermarket Analysis
- MurphyExplainsMarketAnalysis-Visual Analysis
- StockCharts.com
- Technical Analysis of the Financial Markets
- The Visual Investor
- VectorVest, Inc.
- Executive Premier Workshop
- One-Day Options Course
- OptionsPro
- Retirement Income Workshop
- Sure-Fire Trading Systems (VectorVest, Inc.)
- Trading as a Business Workshop
- VectorVest 7 EOD
- VectorVest 7 RealTime/IntraDay
- VectorVest AutoTester
- VectorVest Educational Services
- VectorVest OnLine
- VectorVest Options Analyzer
- VectorVest ProGraphics v6.0
- VectorVest ProTrader 7
- VectorVest RealTime Derby Tool
- VectorVest Simulator
- VectorVest Variator
- VectorVest Watchdog
