HOT TOPICS LIST
- MACD
- Fibonacci
- RSI
- Gann
- ADXR
- Stochastics
- Volume
- Triangles
- Futures
- Cycles
- Volatility
- ZIGZAG
- MESA
- Retracement
- Aroon
INDICATORS LIST
LIST OF TOPICS
PRINT THIS ARTICLE
by Gary Grosschadl
Staples is at a crucial point here, with pattern analysis suggesting a tradable move.
Position: Buy
Gary Grosschadl
Independent Canadian equities trader and technical analyst based in Peterborough
Ontario, Canada.
PRINT THIS ARTICLE
DOUBLE TOPS
Staples Inc. Tests A Double Top
10/22/07 02:49:36 PMby Gary Grosschadl
Staples is at a crucial point here, with pattern analysis suggesting a tradable move.
Position: Buy
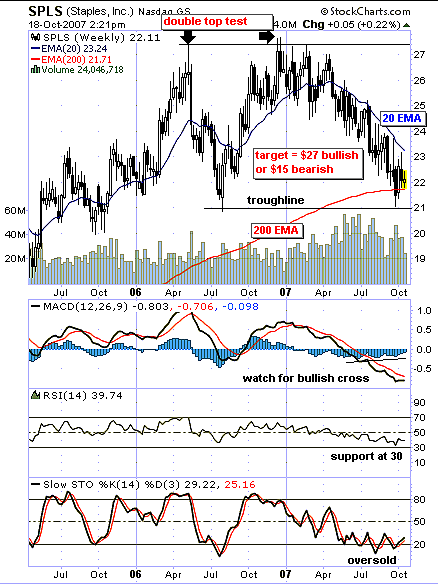
| This multiyear weekly chart shows a double top being tested (Figure 1). After the first peak near $27, a trough line was established at $21. Five months later the second top was established. Those "early bird" traders who surmised a double top could be in the making would have been correct, as a move near $21 did transpire. |
| For a double top to officially be in, the trendline has to be broken to the downside with some conviction. Should this happen with a close below $21, then the double-top completion target becomes $15 or near it. This six-point move is equal to the distance between the peak and the trough as applied to the downside move. |

|
| FIGURE 1: STAPLES, WEEKLY. This chart shows Staples at an important juncture. |
| Graphic provided by: StockCharts.com. |
| |
| By the looks of the current chart, I would be betting the other way, to a move back up to challenge the $27 peak. The double top will be rejected at the current position, the support being the combination of the trendline (previous low) and the ever-important 200-period exponential moving average (EMA). This moving average often acts as significant support or resistance and many a trader or technically minded fund manager watches this level for the signs of a bounce. |
| The indicators below the chart lend themselves to a bullish view going forward. The moving average convergence/divergence (MACD) is at a low level with an uptick possibly emerging. Note the histogram is showing positive divergence, hinting at a potential upswing. The relative strength index (RSI) appears to have found support at 30 while the stochastic oscillator is reverberating in an oversold zone. |
| Should this bullish view prevail, the first hurdle is nearby overhead resistance offered by the 20-period EMA. Success there could signal a serious drive north to challenge previous highs. However, another refusal at the 20-day EMA could drive the stock to once again test the support level between $21 and $22. Failure here could then bring the double-top completion target ($15) into play. Gentlemen, place your bets — $27 or $15? |
Independent Canadian equities trader and technical analyst based in Peterborough
Ontario, Canada.
| Website: | www.whatsonsale.ca/financial.html |
| E-mail address: | gwg7@sympatico.ca |
Click here for more information about our publications!
PRINT THIS ARTICLE

Request Information From Our Sponsors
- StockCharts.com, Inc.
- Candle Patterns
- Candlestick Charting Explained
- Intermarket Technical Analysis
- John Murphy on Chart Analysis
- John Murphy's Chart Pattern Recognition
- John Murphy's Market Message
- MurphyExplainsMarketAnalysis-Intermarket Analysis
- MurphyExplainsMarketAnalysis-Visual Analysis
- StockCharts.com
- Technical Analysis of the Financial Markets
- The Visual Investor
- VectorVest, Inc.
- Executive Premier Workshop
- One-Day Options Course
- OptionsPro
- Retirement Income Workshop
- Sure-Fire Trading Systems (VectorVest, Inc.)
- Trading as a Business Workshop
- VectorVest 7 EOD
- VectorVest 7 RealTime/IntraDay
- VectorVest AutoTester
- VectorVest Educational Services
- VectorVest OnLine
- VectorVest Options Analyzer
- VectorVest ProGraphics v6.0
- VectorVest ProTrader 7
- VectorVest RealTime Derby Tool
- VectorVest Simulator
- VectorVest Variator
- VectorVest Watchdog
