HOT TOPICS LIST
- MACD
- Fibonacci
- RSI
- Gann
- ADXR
- Stochastics
- Volume
- Triangles
- Futures
- Cycles
- Volatility
- ZIGZAG
- MESA
- Retracement
- Aroon
INDICATORS LIST
LIST OF TOPICS
PRINT THIS ARTICLE
by David Penn
Three technical setups helped traders game the market for November soybeans.
Position: N/A
David Penn
Technical Writer for Technical Analysis of STOCKS & COMMODITIES magazine, Working-Money.com, and Traders.com Advantage.
PRINT THIS ARTICLE
TECHNICAL ANALYSIS
Beans Bounce Back: Divergence To BOSO To MACD Histogram Reversal
10/19/07 09:10:39 AMby David Penn
Three technical setups helped traders game the market for November soybeans.
Position: N/A
| The rally in November soybeans over the past few months provides a great opportunity to show one of my favorite setup combinations. This combination, which relies on the moving average convergence/divergence (MACD) histogram, the stochastic, and the MACD histogram again to provide signals, allows traders to use basic momentum techniques to exploit a market for longer than the typically short time frame most momentum traders are relegated to trading. |
| The beauty of momentum trading is that the rewards, when the trade is a good one, are swift. Those rewards, however, are also modest compared to those gained, for example, by trend traders. One way to extend these rewards is to use multiple tools to position oneself for the multiple surges in momentum that occur during a trend. |

|
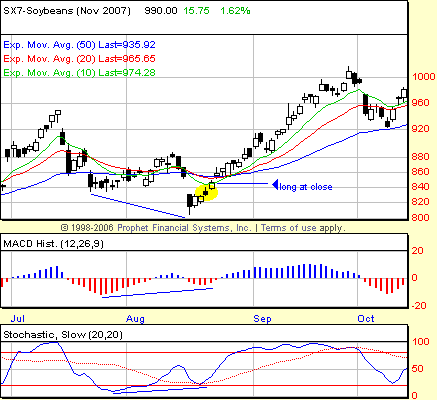
| FIGURE 1: SOYBEANS, NOVEMBER FUTURES, DAILY. Positive divergences in both the MACD histogram and the stochastic helped alert traders that the break below support in mid-August was more of a potential opportunity for the bulls than the bears. |
| Graphic provided by: Prophet Financial, Inc. |
| |
| The combination begins with a reversal signal in the MACD histogram and the stochastic. Trader Victor Sperandeo once noted that "identifying a change in trend" is "where fortunes are made." So this combination begins with the positive divergences in both the MACD histogram and the stochastic relating to the lows in late July and the second half of August. As Figure 1 shows, these positive divergences were in place as of the close of August 21 (see the highlighted candlestick in the price chart). All that would be required for a trader to take a long position would be a follow-through, confirming close above the high of the August 21st session. That follow-through, confirming close came only one day later at $8.47. The stop-loss point on this trade was as loose at the low of the positive divergence ($8.04-1/2, on August 16) or as tight as the low of the "signal session" on the 21st ($8.29), depending on the risk tolerance of the trader. |
| My thinking on positive divergence plays in which the trade is being made off the bottom is that the maximum room possible be given to allow the trade to develop. If the market indeed has bottomed, there will be plenty of upside for those who are patient. If the market goes on to take out the low of the positive divergence, then clearly the market has not yet bottomed and the long trade can be confidently abandoned. Another excellent momentum opportunity developed five days after the positive divergence-based entry. This opportunity was a stochastic breakout (BOSO) as the stochastic crossed above the 80 overbought level as of the close of August 29. With a follow-through, confirming close the following session at $8.85, traders would have suffered a one-day, intrasession drawdown of about three cents ($150 per contract) before November beans were once again off to the races, moving higher. |

|
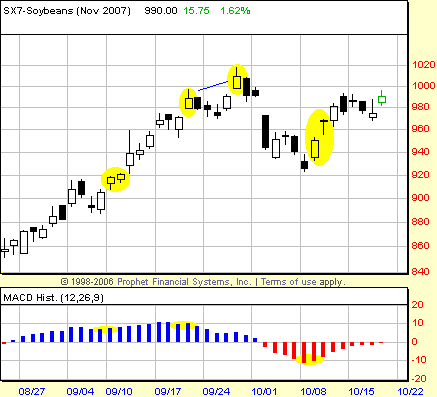
| FIGURE 2: SOYBEANS, NOVEMBER FUTURES, DAILY. The ovals in the indicator pane represent the MACD histogram buy signals. The ovals in the price pane reflect the session during which the signal occurred and the accompanying session during which the follow-through, confirming close occurred. |
| Graphic provided by: Prophet Financial, Inc. |
| |
| There were a number of other opportunities for traders to climb on board the November soybean bandwagon in September and October. Once a trend is in place — you can tell by the fact that the market became overbought and remained overbought for all of September — traders can use patterns in the MACD histogram to time entries. See Figure 2. As I have written before for Working-Money.com, ("Trading The MACD Histogram, Parts I and II," from December 9 and December 26, 2006, respectively), one pattern to look for when the histogram is positive is the MmM pattern. This pattern occurred three times after the BOSO entry — a very profitable entry on the close of September 11 at $9.20-1/2, an entry on September 27 that would have been a loser, and another very profitable entry on October 10 at $9.68-1/4. These are in addition to the profitable positive divergence and BOSO trades already outlined. |
Technical Writer for Technical Analysis of STOCKS & COMMODITIES magazine, Working-Money.com, and Traders.com Advantage.
| Title: | Technical Writer |
| Company: | Technical Analysis, Inc. |
| Address: | 4757 California Avenue SW |
| Seattle, WA 98116 | |
| Phone # for sales: | 206 938 0570 |
| Fax: | 206 938 1307 |
| Website: | www.Traders.com |
| E-mail address: | DPenn@traders.com |
Traders' Resource Links | |
| Charting the Stock Market: The Wyckoff Method -- Books | |
| Working-Money.com -- Online Trading Services | |
| Traders.com Advantage -- Online Trading Services | |
| Technical Analysis of Stocks & Commodities -- Publications and Newsletters | |
| Working Money, at Working-Money.com -- Publications and Newsletters | |
| Traders.com Advantage -- Publications and Newsletters | |
| Professional Traders Starter Kit -- Software | |
Click here for more information about our publications!
Comments
Date: 04/29/08Rank: 5Comment:

Request Information From Our Sponsors
- VectorVest, Inc.
- Executive Premier Workshop
- One-Day Options Course
- OptionsPro
- Retirement Income Workshop
- Sure-Fire Trading Systems (VectorVest, Inc.)
- Trading as a Business Workshop
- VectorVest 7 EOD
- VectorVest 7 RealTime/IntraDay
- VectorVest AutoTester
- VectorVest Educational Services
- VectorVest OnLine
- VectorVest Options Analyzer
- VectorVest ProGraphics v6.0
- VectorVest ProTrader 7
- VectorVest RealTime Derby Tool
- VectorVest Simulator
- VectorVest Variator
- VectorVest Watchdog
- StockCharts.com, Inc.
- Candle Patterns
- Candlestick Charting Explained
- Intermarket Technical Analysis
- John Murphy on Chart Analysis
- John Murphy's Chart Pattern Recognition
- John Murphy's Market Message
- MurphyExplainsMarketAnalysis-Intermarket Analysis
- MurphyExplainsMarketAnalysis-Visual Analysis
- StockCharts.com
- Technical Analysis of the Financial Markets
- The Visual Investor
