HOT TOPICS LIST
- MACD
- Fibonacci
- RSI
- Gann
- ADXR
- Stochastics
- Volume
- Triangles
- Futures
- Cycles
- Volatility
- ZIGZAG
- MESA
- Retracement
- Aroon
INDICATORS LIST
LIST OF TOPICS
PRINT THIS ARTICLE
by David Penn
An ascending triangle bottom in August and September hints at higher prices for the greenback against the yen.
Position: N/A
David Penn
Technical Writer for Technical Analysis of STOCKS & COMMODITIES magazine, Working-Money.com, and Traders.com Advantage.
PRINT THIS ARTICLE
BREAKOUTS
USD/JPY: Breakout And Pullback Off The Bottom
10/18/07 09:05:05 AMby David Penn
An ascending triangle bottom in August and September hints at higher prices for the greenback against the yen.
Position: N/A
| The last time I took a look at the greenback/yen currency pair for Traders.com Advantage ("The USD/JPY Breakout Stalls At Target," June 22, 2007), the market had just reached a projected target near 123.50. The significance of this level was that it coincided perfectly with a swing rule–derived projection based on a dip in early June. |
| What I did not know at the time was that not only had the USD/JPY reached its swing rule target, but the pair had also reached the end of the advance it had enjoyed since an early March bottom just north of 115. In fact, the day the article was posted was the day when the USD/JPY topped out with an intrasession high 124.15. |

|
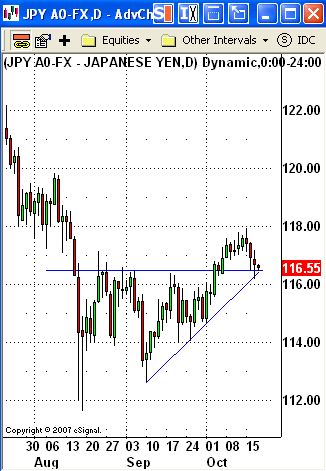
| FIGURE 1: US DOLLAR/JAPANESE YEN, DAILY. An early October breakout in the USD/JPY finds resistance at the 118 level and pulls back to find support at the breakout level near 116.50. |
| Graphic provided by: eSignal. |
| |
| Since that top, the USD/JPY has been in a dizzying meltdown, falling from just above 124 in late June to as low as 112 on an intrasession basis in the first half of August. In the month since the August bottom, the USD/JPY has consolidated in a largely sideways range with a slight upward bias. Whether this consolidation's upward bias — and its virtually horizontal support level at about 116.50 — is a true ascending triangle is probably immaterial. But what seems clear is that the market for USD/JPY did break out of that consolidation in earliest October and, by midmonth, has executed a test of resistance-turned-support at the breakout level. See Figure 1. |
| It can be helpful to consider a failed breakout like the handle of a cup with handle pattern. The handle often develops as an attempted move to breakout fails. Because the market has upside momentum, the pullback is relatively shallow — more shallow, for example, than the correction that caused the cup — and the resumption of upside momentum tends to be swift. Similarly, a failed breakout such as the one in USD/JPY serves to shake out weak hands before the "real" breakout occurs sometime afterward. These weak hands returning to the market is in large part what helps produce the often-sizable moves after breakouts that initially fail. |
| The consolidation measures from 116.50 to about 113 at its widest point, suggesting an upside move to as high as 120. Interestingly, the 120 level also represents the August highs in the USD/JPY and, save for the newly created, potential resistance at 118, is the only thing likely to stem an advance in the USD/JPY. |
Technical Writer for Technical Analysis of STOCKS & COMMODITIES magazine, Working-Money.com, and Traders.com Advantage.
| Title: | Technical Writer |
| Company: | Technical Analysis, Inc. |
| Address: | 4757 California Avenue SW |
| Seattle, WA 98116 | |
| Phone # for sales: | 206 938 0570 |
| Fax: | 206 938 1307 |
| Website: | www.Traders.com |
| E-mail address: | DPenn@traders.com |
Traders' Resource Links | |
| Charting the Stock Market: The Wyckoff Method -- Books | |
| Working-Money.com -- Online Trading Services | |
| Traders.com Advantage -- Online Trading Services | |
| Technical Analysis of Stocks & Commodities -- Publications and Newsletters | |
| Working Money, at Working-Money.com -- Publications and Newsletters | |
| Traders.com Advantage -- Publications and Newsletters | |
| Professional Traders Starter Kit -- Software | |
Click here for more information about our publications!
PRINT THIS ARTICLE

|

Request Information From Our Sponsors
- StockCharts.com, Inc.
- Candle Patterns
- Candlestick Charting Explained
- Intermarket Technical Analysis
- John Murphy on Chart Analysis
- John Murphy's Chart Pattern Recognition
- John Murphy's Market Message
- MurphyExplainsMarketAnalysis-Intermarket Analysis
- MurphyExplainsMarketAnalysis-Visual Analysis
- StockCharts.com
- Technical Analysis of the Financial Markets
- The Visual Investor
- VectorVest, Inc.
- Executive Premier Workshop
- One-Day Options Course
- OptionsPro
- Retirement Income Workshop
- Sure-Fire Trading Systems (VectorVest, Inc.)
- Trading as a Business Workshop
- VectorVest 7 EOD
- VectorVest 7 RealTime/IntraDay
- VectorVest AutoTester
- VectorVest Educational Services
- VectorVest OnLine
- VectorVest Options Analyzer
- VectorVest ProGraphics v6.0
- VectorVest ProTrader 7
- VectorVest RealTime Derby Tool
- VectorVest Simulator
- VectorVest Variator
- VectorVest Watchdog
