HOT TOPICS LIST
- MACD
- Fibonacci
- RSI
- Gann
- ADXR
- Stochastics
- Volume
- Triangles
- Futures
- Cycles
- Volatility
- ZIGZAG
- MESA
- Retracement
- Aroon
INDICATORS LIST
LIST OF TOPICS
PRINT THIS ARTICLE
by Chaitali Mohile
Financials Select Sector SPDR makes a U-turn from long-term moving average resistance.
Position: N/A
Chaitali Mohile
Active trader in the Indian stock markets since 2003 and a full-time writer. Trading is largely based upon technical analysis.
PRINT THIS ARTICLE
SUPPORT & RESISTANCE
Weak XLF Turns Weaker
10/18/07 12:30:39 PMby Chaitali Mohile
Financials Select Sector SPDR makes a U-turn from long-term moving average resistance.
Position: N/A
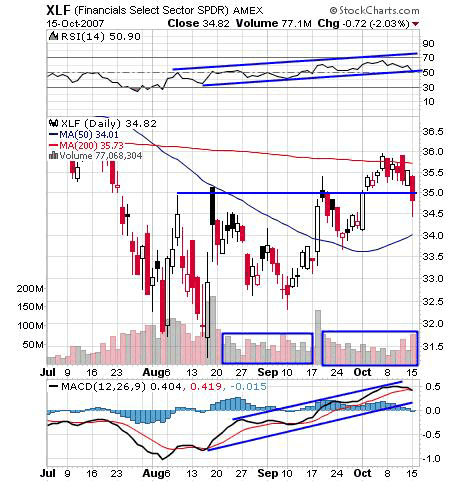
| In the Financials Select Sector SPDR (XLF), the price slipped below the 200-day moving average support, losing $8 in mid-July 2007. The 200-day MA was the strongest resistance, with the 50-day MA moving below, creating a bearish moving crossover. The XLF now has bears hovering over the price momentum. The price was constantly dipping to the lower levels around 32 until some support of the 50-day MA was established. The resistances were much stronger than the fresh support; the 35 level was the previous high resistance that weakened the bounce. Though this hurdle was violated with a single-day bounce in early October 2007, the rally weakened further in the absence of good volume. The breakout rally could achieve the 200-day MA resistance as its first target. The XLF tried to accumulate the strength for the surge by consolidating around the new resistance area. |

|
| FIGURE 1: XLF, DAILY. The 200-day moving average resistance weakened the advance rally and began the downside move. If the indicators turn bearish from here and volume continue to diminish, then the next support of the 50-day MA is likely to get tested. |
| Graphic provided by: StockCharts.com. |
| |
| The upside journey was on bullish strength of the relative strength index (RSI)(14). The oscillator was marginally oversold as the price slipped to the lower level of 32. The fast recovery of RSI(14) helped sustain the price close to the resistance area. Even as the price was consolidating near the 200-day MA resistance, the RSI(14) was holding its bullish levels. The moving average convergence/divergence (MACD) was equally positive toward the breakout procedure until the long-term resistance was hit back. The MACD (12,24,9) has positive divergence that added a forced rally ahead of the previous high pivot. See Figure 1. |
| However, the consolidation was losing its steam in presence of bearish force. But yesterday's midday profit-booking boosted the bears; as a result, the XLF made a U-turn from the resistance level. The price closed below the previous high support but has few other supports, like the 50-day MA support. Though not alarming as of now, the only concern is about the indicators. If the profit-booking continues, the MACD (12,26,9) and the RSI (14) can be brought to below their bullish level. |

|
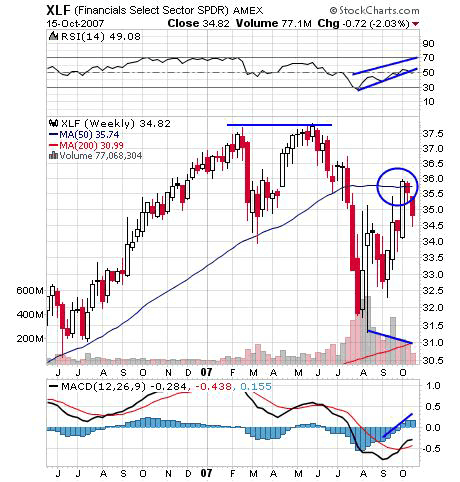
| FIGURE 2: XLF, WEEKLY. Earlier with the support of the 50-day MA, a new advance rally was born. The same support is now resistance after the large correction during May to July. |
| Graphic provided by: StockCharts.com. |
| |
| The double-top effect on the weekly chart turned the price below the 50-day MA support (Figure 2). As this support was left behind, the downfall went stronger, reaching the lowest level of 31.5. The pullback was supported by appreciated volume initially, but as the trading range narrowed, the volume lowered as well. In addition, the RSI (14) had great difficulty crossing the 50 level, and the price too hit its 50-day MA resistance. The MACD (12,26,9) is under negative territory with a bullish crossover. The price momentum on both time frames is under strong resistance. In addition, the profit-booking poured bearish force, dragging the price toward the support. |
| Therefore, the XLF in presence of powerful bears has made a U-turn and is likely to move lower if the indicators turn bearish as well. |
Active trader in the Indian stock markets since 2003 and a full-time writer. Trading is largely based upon technical analysis.
| Company: | Independent |
| Address: | C1/3 Parth Indraprasth Towers. Vastrapur |
| Ahmedabad, Guj 380015 | |
| E-mail address: | chaitalimohile@yahoo.co.in |
Traders' Resource Links | |
| Independent has not added any product or service information to TRADERS' RESOURCE. | |
Click here for more information about our publications!
PRINT THIS ARTICLE

Request Information From Our Sponsors
- StockCharts.com, Inc.
- Candle Patterns
- Candlestick Charting Explained
- Intermarket Technical Analysis
- John Murphy on Chart Analysis
- John Murphy's Chart Pattern Recognition
- John Murphy's Market Message
- MurphyExplainsMarketAnalysis-Intermarket Analysis
- MurphyExplainsMarketAnalysis-Visual Analysis
- StockCharts.com
- Technical Analysis of the Financial Markets
- The Visual Investor
- VectorVest, Inc.
- Executive Premier Workshop
- One-Day Options Course
- OptionsPro
- Retirement Income Workshop
- Sure-Fire Trading Systems (VectorVest, Inc.)
- Trading as a Business Workshop
- VectorVest 7 EOD
- VectorVest 7 RealTime/IntraDay
- VectorVest AutoTester
- VectorVest Educational Services
- VectorVest OnLine
- VectorVest Options Analyzer
- VectorVest ProGraphics v6.0
- VectorVest ProTrader 7
- VectorVest RealTime Derby Tool
- VectorVest Simulator
- VectorVest Variator
- VectorVest Watchdog
