HOT TOPICS LIST
- MACD
- Fibonacci
- RSI
- Gann
- ADXR
- Stochastics
- Volume
- Triangles
- Futures
- Cycles
- Volatility
- ZIGZAG
- MESA
- Retracement
- Aroon
INDICATORS LIST
LIST OF TOPICS
PRINT THIS ARTICLE
by David Penn
A confirmed BOSO breakout follows both a MACD histogram positive divergence and a sizable MACD histogram peak.
Position: N/A
David Penn
Technical Writer for Technical Analysis of STOCKS & COMMODITIES magazine, Working-Money.com, and Traders.com Advantage.
PRINT THIS ARTICLE
REVERSAL
10-Year Treasury Yields: Up, Up, And Away?
10/16/07 08:59:18 AMby David Penn
A confirmed BOSO breakout follows both a MACD histogram positive divergence and a sizable MACD histogram peak.
Position: N/A
| Yields on 10-year Treasury notes ($TNX) -- the proxy for the cost of long-term borrowing -- peaked in mid-June of this year and by mid-July, yields, as measured by the $TNX, were in full-blown decline. It was in July that the $TNX slipped below its 50-day exponential moving average (EMA) and, perhaps even more convincing, became dramatically oversold as measured by the stochastic oscillator. |
| In fact, save for four days in early August, 10-year Treasury note yields were oversold from mid-July to mid-September, representing an excellent trend trading opportunity for bond bulls. |

|
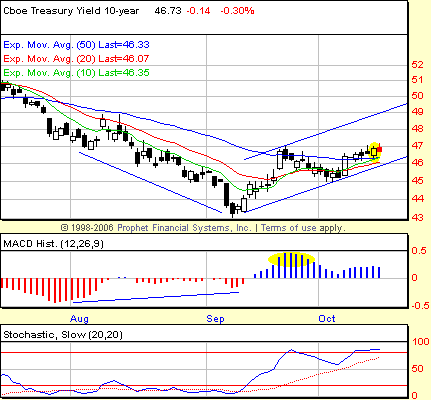
| FIGURE 1: 10-YEAR TREASURY NOTE YIELD ($TNX), DAILY. A running positive divergence in the MACD histogram helps indicate a bottom in early September. Note the size of the MACD histogram (highlighted and in blue) that develops shortly after the bottom is made. Note also the highlighted candlestick in the price panel, which represents the entry session for the long BOSO trade based on the stochastic. |
| Graphic provided by: Prophet Financial, Inc. |
| |
| My favorite scenario to look for in a market that has been or may be in the process of bottoming is to look first for the positive divergence, which indicates waning momentum to the downside. The second thing I like to see is a bounce that features either a moving average convergence/divergence (MACD) histogram peak that towers over all recent MACD histogram peaks going back more than a few months, and a BOSO breakout (that is, a stochastic becoming newly overbought). See Figure 1. |
| The current case of the $TNX features both characteristics. The MACD histogram peak is the largest in $TNX going back for two years in the daily charts. With regard to the stochastic and the BOSO breakout, the $TNX attempted such a breakout on September 24, but there was no close above the high of that session in order to confirm the move. Confirmation did come, however, on October 12, as the $TNX closed above the highs of both the old September 24th session and a newer BOSO buy signal from October 9. |
| Although it is always possible for a market to retest the lows after a bounce, the technical makeup of the market seems to suggest that such a retest is less likely in this case. Not only does the newly overbought stochastic strongly suggest higher prices before lower ones, but also the advance off the bottom thus far has been contained by trend channel. What is particularly interesting about the lower boundary of the trend channel as mid-October approaches is the way that boundary has synched with the 10-, 20-, and 50-day EMAs to create at least the appearance of strong support at the 46 level. |
Technical Writer for Technical Analysis of STOCKS & COMMODITIES magazine, Working-Money.com, and Traders.com Advantage.
| Title: | Technical Writer |
| Company: | Technical Analysis, Inc. |
| Address: | 4757 California Avenue SW |
| Seattle, WA 98116 | |
| Phone # for sales: | 206 938 0570 |
| Fax: | 206 938 1307 |
| Website: | www.Traders.com |
| E-mail address: | DPenn@traders.com |
Traders' Resource Links | |
| Charting the Stock Market: The Wyckoff Method -- Books | |
| Working-Money.com -- Online Trading Services | |
| Traders.com Advantage -- Online Trading Services | |
| Technical Analysis of Stocks & Commodities -- Publications and Newsletters | |
| Working Money, at Working-Money.com -- Publications and Newsletters | |
| Traders.com Advantage -- Publications and Newsletters | |
| Professional Traders Starter Kit -- Software | |
Click here for more information about our publications!
Comments
Date: 04/29/08Rank: 5Comment:

|

Request Information From Our Sponsors
- StockCharts.com, Inc.
- Candle Patterns
- Candlestick Charting Explained
- Intermarket Technical Analysis
- John Murphy on Chart Analysis
- John Murphy's Chart Pattern Recognition
- John Murphy's Market Message
- MurphyExplainsMarketAnalysis-Intermarket Analysis
- MurphyExplainsMarketAnalysis-Visual Analysis
- StockCharts.com
- Technical Analysis of the Financial Markets
- The Visual Investor
- VectorVest, Inc.
- Executive Premier Workshop
- One-Day Options Course
- OptionsPro
- Retirement Income Workshop
- Sure-Fire Trading Systems (VectorVest, Inc.)
- Trading as a Business Workshop
- VectorVest 7 EOD
- VectorVest 7 RealTime/IntraDay
- VectorVest AutoTester
- VectorVest Educational Services
- VectorVest OnLine
- VectorVest Options Analyzer
- VectorVest ProGraphics v6.0
- VectorVest ProTrader 7
- VectorVest RealTime Derby Tool
- VectorVest Simulator
- VectorVest Variator
- VectorVest Watchdog
