HOT TOPICS LIST
- MACD
- Fibonacci
- RSI
- Gann
- ADXR
- Stochastics
- Volume
- Triangles
- Futures
- Cycles
- Volatility
- ZIGZAG
- MESA
- Retracement
- Aroon
INDICATORS LIST
LIST OF TOPICS
PRINT THIS ARTICLE
by Chaitali Mohile
The short-term moving average offered support during wide-range volatile days. These shaky moves are likely to sustain until some descending directional moves come in.
Position: N/A
Chaitali Mohile
Active trader in the Indian stock markets since 2003 and a full-time writer. Trading is largely based upon technical analysis.
PRINT THIS ARTICLE
TECHNICAL ANALYSIS
AIT Volatile, Holding Strong Support
10/16/07 11:26:39 AMby Chaitali Mohile
The short-term moving average offered support during wide-range volatile days. These shaky moves are likely to sustain until some descending directional moves come in.
Position: N/A
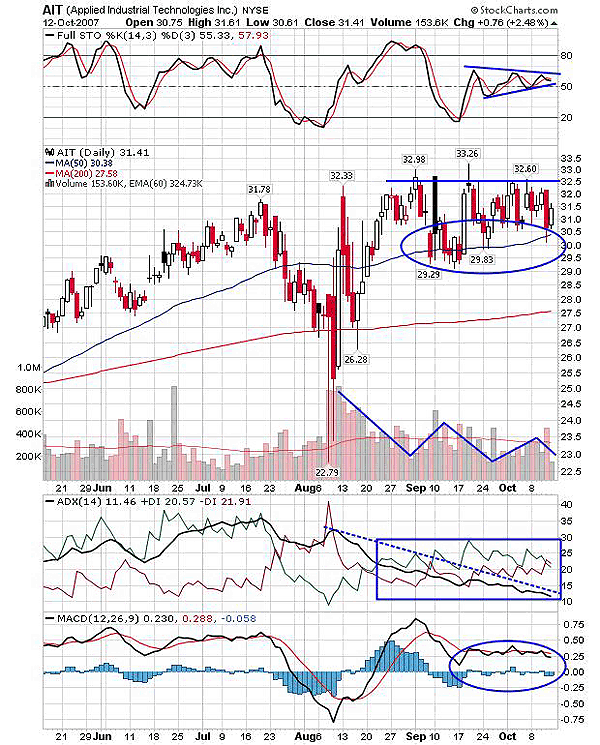
| The advance rally from $26.28 to $32.98 (~33) brought in fresh volatility in Applied Industrial Technologies (AIT). Since then the 50-day moving average acted as a strong support of the rally. The first decline that followed the rally retraced back to the 50-day moving average support. The consolidation strengthened the support, gearing up the upside rally that surged above the previous high. Volume remained shaky through the rally. Every high and low test within the range changed the volume supply as well. The zigzag move on Figure 1 shows the diminishing interest in the stock. |

|
| FIGURE 1: AIT, DAILY. The diminishing volume and weakening trend are bringing up more volatility in the stock. The support of the 50-day moving average is most likely to be sustained with positive positions of stochastic (14,3,3) and the MACD (12,26,9). |
| Graphic provided by: StockCharts.com. |
| |
| A symmetrical triangle formation on stochastic (14,3,3) narrowed further, the effect of which may make the price action more complicated. The moving average convergence/divergence (MACD)(12,26,9) also has tangled moves across the trigger line with no perfect direction for crossover. The bullish or bearish crossover can at least help decide the breakout direction. Now, I have a bullish bias for the breakout though the volatility could continue. The stochastic (14,3,3) has sustained above the bullish level of 50 and the triangle is likely to mature soon, though the MACD (12,26,9) is undergoing a move in positive territory of the indicator. |
| Now, the average directional movement index (ADX)(14) has declined from 30 to 11, with positive directional index (+DI) and negative directional index (-DI) interacting closer to each other. Therefore, the trend indicator suggests weakness in either trend with equal participation of bulls and bears. The wide range volatility is thus likely to continue till either of the trends regains its strength. The support of the 50-day moving average will help the price remain bullish during the volatile sessions. |

|
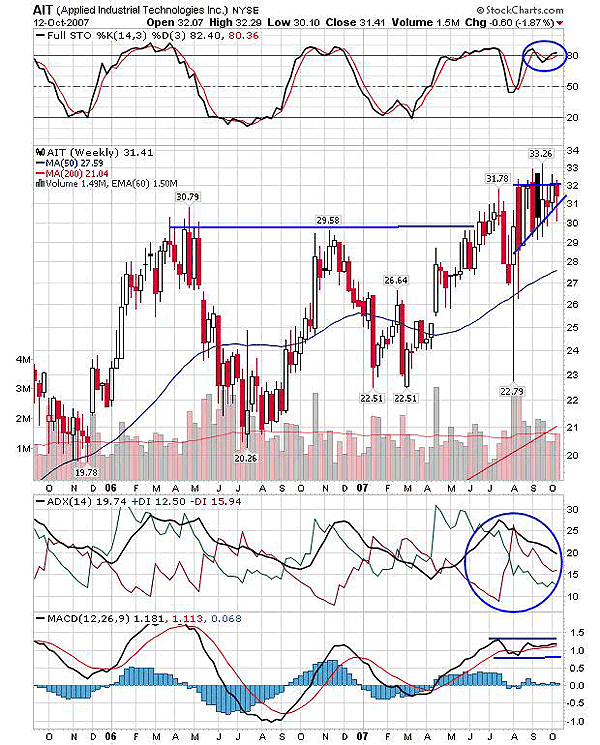
| FIGURE 2: AIT, WEEKLY. The breakout of the neckline could hardly reach the high of 33.26. |
| Graphic provided by: StockCharts.com. |
| |
| On the weekly chart (Figure 2), the deep valleys are being formed with a resistance line around 29.50 levels. The breakout above resistance made a new high at 33.29 but on a very weak rally. The higher lows and constant upper side resistance at 32 formed an ascending triangle. The breakout on this triangle usually occurs on the upside. And the indicators on the charts also suggest the positive surge. |
| The stochastic (14,3,3) is still overbought and that can add strength to the upside breakout. The ADX (14) is again indicating weakness in an uptrend that can result in a volatile consolidation at this level. Traders should note that -DI is also declining along with +DI so selling pressure is reducing with increasing volatility. The MACD (12,26,9) is marginally positive above the trigger line but steady in positive territory . This adds confirmation for my bullish bias. To conclude, AIT will remain volatile but is more likely to hold its bullish supports on the rally. The breakout above 33.50 should be watched for buying with a bullish confirmation on indicators. |
Active trader in the Indian stock markets since 2003 and a full-time writer. Trading is largely based upon technical analysis.
| Company: | Independent |
| Address: | C1/3 Parth Indraprasth Towers. Vastrapur |
| Ahmedabad, Guj 380015 | |
| E-mail address: | chaitalimohile@yahoo.co.in |
Traders' Resource Links | |
| Independent has not added any product or service information to TRADERS' RESOURCE. | |
Click here for more information about our publications!
PRINT THIS ARTICLE

Request Information From Our Sponsors
- StockCharts.com, Inc.
- Candle Patterns
- Candlestick Charting Explained
- Intermarket Technical Analysis
- John Murphy on Chart Analysis
- John Murphy's Chart Pattern Recognition
- John Murphy's Market Message
- MurphyExplainsMarketAnalysis-Intermarket Analysis
- MurphyExplainsMarketAnalysis-Visual Analysis
- StockCharts.com
- Technical Analysis of the Financial Markets
- The Visual Investor
- VectorVest, Inc.
- Executive Premier Workshop
- One-Day Options Course
- OptionsPro
- Retirement Income Workshop
- Sure-Fire Trading Systems (VectorVest, Inc.)
- Trading as a Business Workshop
- VectorVest 7 EOD
- VectorVest 7 RealTime/IntraDay
- VectorVest AutoTester
- VectorVest Educational Services
- VectorVest OnLine
- VectorVest Options Analyzer
- VectorVest ProGraphics v6.0
- VectorVest ProTrader 7
- VectorVest RealTime Derby Tool
- VectorVest Simulator
- VectorVest Variator
- VectorVest Watchdog
