

HOT TOPICS LIST
- MACD
- Fibonacci
- RSI
- Gann
- ADXR
- Stochastics
- Volume
- Triangles
- Futures
- Cycles
- Volatility
- ZIGZAG
- MESA
- Retracement
- Aroon
INDICATORS LIST
LIST OF TOPICS
PRINT THIS ARTICLE
by Paolo Pezzutti
The pattern was completed last Thursday on news of higher September sales.
Position: N/A
Paolo Pezzutti
Author of the book "Trading the US Markets - A Comprehensive Guide to US Markets for International Traders and Investors" - Harriman House (July 2008)
PRINT THIS ARTICLE
REVERSAL
Wal-Mart: A Bullish Reversal Island Pattern
10/15/07 02:47:01 PMby Paolo Pezzutti
The pattern was completed last Thursday on news of higher September sales.
Position: N/A
| The island reversal pattern provides a reliable indication of a trend reversal. Let's see how the pattern develops. An island bottom is formed when prices gap lower after an extended downtrend, leaving the gap open one or more days, then closing the gap and moving higher. The downward exhaustion gap sometimes opens a trading range phase before gapping to the upside. The price action looks like an island, surrounded by space or water. A breakaway gap to the upside completes the island reversal pattern and usually indicates a trend reversal. Normally, very high volume is printed in coincidence with the exhaustion and the breakaway gaps. This indicates that the public is participating emotionally to the stock's move. Often, the gaps occur when news is released. The closure of the gap prints high volume when some market participants realize that their short positions are wrong and others get excited because of the good news and open new long trades. This pattern can develop a significant reversal, depending on the context, and how prices fit in the general structure of the market action. The converse is true for island tops. The market can trade for several sessions before the second gap in the opposite direction forms. False signals may occur and you might want to wait and see if the second gap gets filled before opening a position. This will reduce your risk, of course, but also the profit opportunity. It is the usual tradeoff between risk and reward, which must be analyzed when making decisions, according to the trading style adopted. |
|
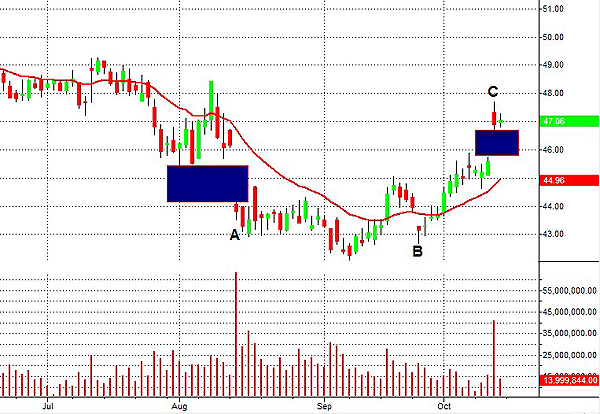
| FIGURE 1: WMT DAILY CHART. The down and the up gaps that form the pattern printed high volume, indicating the emotional involvement of the public (points A and C). A second gap to the downside (point B) was printed on much lower volume and it was closed pretty soon. |
| Graphic provided by: TradeStation. |
| |
| Let's start analyzing the price action of Wal-Mart (WMT) during the past months. In Figure 1, you can see the daily chart (Figure 1). The pattern was initiated on August 14 this year (point A) when Wal-Mart Stores reported a lower-than-expected quarterly profit on Tuesday and cut its full-year earnings forecast. With more than 127 million customers weekly, Wal-Mart provides data considered a reference of the nation's retail sector. This was confirming the possibility of a slowdown of the US economy. In the middle of the subprime mortgage crisis, the fear of an impact to other sectors of the economy was concrete. WMT printed the highest volume since September 2006 with more 63 million shares traded, though the stock lost 2.35 points, closing at $43.82. The market reacted emotionally to the news and the public got rid of their shares at whatever price that morning. The next day prices were still down, but you have to consider that a dividend of 22 cents was distributed. Prices in August developed a flag and resumed the downtrend to print a new low on September 10. After a rebound, WMT printed another down gap on September 25, but with much lower volume than on August 14. The gap was readily closed and that was the signal that something was about to change. The reversal island pattern was completed last Thursday (point C) when WMT reported a 1.4% rise in September sales at US stores open with at least a year raising its earnings forecast. The discount retailer said it now expects third-quarter earnings from continuing operations of 66 cents to 69 cents per share, up from a previous forecast of 62 cents to 65 cents. In coincidence with the news, prices gapped up on high volume, although almost one third lower than on occasion of the August gap. For the formation to be effective it is fundamental that the up gap is not closed in the next sessions. That represents a stop-loss, but also an indication that the continuation of the move to the upside is unlikely. |
|
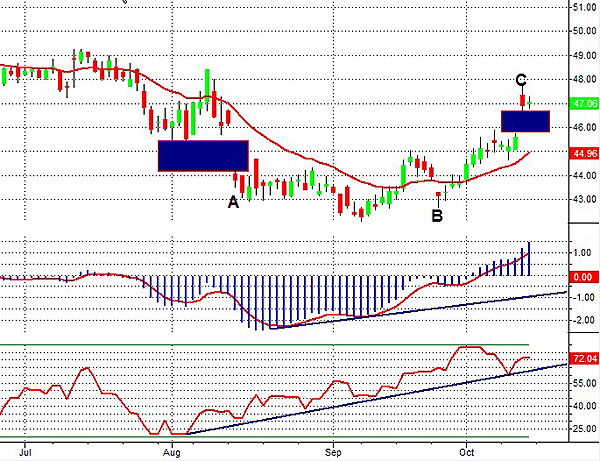
| FIGURE 2: WMT DAILY CHART. A positive divergence of MACD and money flow was developed in September. Divergences can provide many false signals, but when associated to other patterns can contribute to build the big picture. |
| Graphic provided by: TradeStation. |
| |
| From the technical perspective, you can see in Figure 2 that both the moving average convergence/divergence (MACD) and the money flow indicators printed a positive divergence at point B. In particular the money flow indicates that accumulation has been ongoing on the stock since last August. |
|
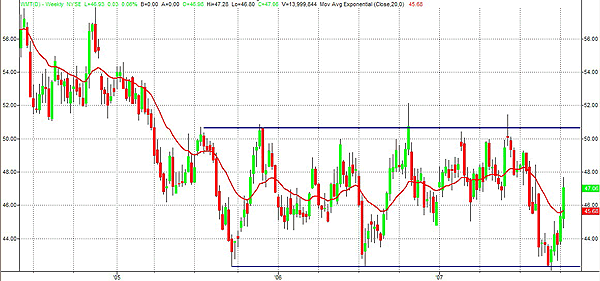
| FIGURE 3: WMT WEEKLY CHART. During the past years the stock has been moving sideways within within a wide channel. |
| Graphic provided by: TradeStation. |
| |
| What is the upside potential of the stock? In Figure 3, you can see the weekly chart. Note that since 2005, WMT has been moving within a wide sideways channel between $42 and $51. In August the stock tested successfully the support of the channel. To the upside, therefore, the resistance is identified with the upper trendline at $51. The reward is about $4 and the risk is about $2. The risk/reward ratio is not that great, but this is typical when you wait to have signals confirmed before opening a position. A more efficient entry would have been the closure of the gap at point B in Figure 1, which presented a higher potential to the upside. |
| I personally like this pattern because it clearly identifies a stop-loss and it is easy to implement. As an option, if you want to reduce your stop-loss, you can wait and see if a tentative closure of the gap occurs and then fails with a quick resumption of the up move. |
Author of the book "Trading the US Markets - A Comprehensive Guide to US Markets for International Traders and Investors" - Harriman House (July 2008)
| Address: | VIA ROBERTO AGO 26 POSTAL CODE 00166 |
| Rome, ITALY | |
| Phone # for sales: | +393357540708 |
| E-mail address: | pezzutti.paolo@tiscali.it |
Click here for more information about our publications!
PRINT THIS ARTICLE

Request Information From Our Sponsors
- StockCharts.com, Inc.
- Candle Patterns
- Candlestick Charting Explained
- Intermarket Technical Analysis
- John Murphy on Chart Analysis
- John Murphy's Chart Pattern Recognition
- John Murphy's Market Message
- MurphyExplainsMarketAnalysis-Intermarket Analysis
- MurphyExplainsMarketAnalysis-Visual Analysis
- StockCharts.com
- Technical Analysis of the Financial Markets
- The Visual Investor
- VectorVest, Inc.
- Executive Premier Workshop
- One-Day Options Course
- OptionsPro
- Retirement Income Workshop
- Sure-Fire Trading Systems (VectorVest, Inc.)
- Trading as a Business Workshop
- VectorVest 7 EOD
- VectorVest 7 RealTime/IntraDay
- VectorVest AutoTester
- VectorVest Educational Services
- VectorVest OnLine
- VectorVest Options Analyzer
- VectorVest ProGraphics v6.0
- VectorVest ProTrader 7
- VectorVest RealTime Derby Tool
- VectorVest Simulator
- VectorVest Variator
- VectorVest Watchdog