HOT TOPICS LIST
- MACD
- Fibonacci
- RSI
- Gann
- ADXR
- Stochastics
- Volume
- Triangles
- Futures
- Cycles
- Volatility
- ZIGZAG
- MESA
- Retracement
- Aroon
INDICATORS LIST
LIST OF TOPICS
PRINT THIS ARTICLE
by Koos van der Merwe
As a technician, I try not to let fundamentals influence me simply because I am in a hurry.
Position: Buy
Koos van der Merwe
Has been a technical analyst since 1969, and has worked as a futures and options trader with First Financial Futures in Johannesburg, South Africa.
PRINT THIS ARTICLE
ELLIOTT WAVE
Making A Bet, Or Is It A Sure Thing?
10/15/07 01:07:06 PMby Koos van der Merwe
As a technician, I try not to let fundamentals influence me simply because I am in a hurry.
Position: Buy
| Technical analysis looks at patterns and reliable indicators to determine the movement of a stock. Fundamental analysis looks at the financial results of good management and then attempts to project the future financial performance of the companies they have studied. Short term for a fundamentalist is measured in years, while for a technical analyst, it could be hours. |
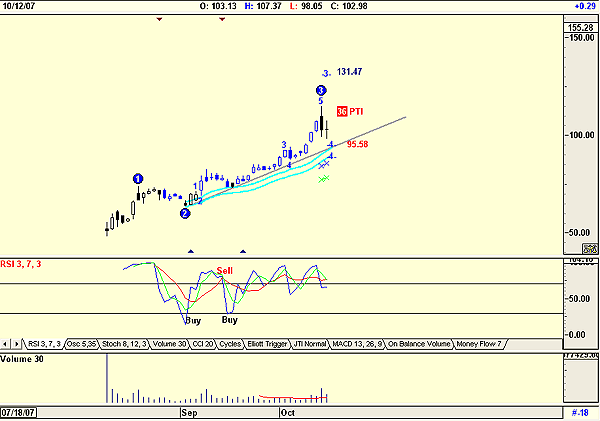
| One stock that has had a recent initial public offering is VMWare (VMW). What attracted me to it was the statement made by CNBC's Jim Cramer when he was asked what he thought about the company. "Not much to say, " he replied. "It could be another Google. Buy it and hold it." The stock hit the market on August 14 at $51.65. It closed at $102.98 on Friday, October 12, after hitting a high of $115.71 on Thursday, October 11. |

|
| FIGURE 1: VMWARE INC. Is this stock a sure thing or is it a gamble? |
| Graphic provided by: AdvancedGET. |
| |
| So what technical indicators can you use to forecast the stock's movement? My favorite in cases where data is so limited are as follows: 1. A three-period relative strength index (RSI) indicator, which gave a buy signal on September 5, another on September 17, after a sell signal on September 14. This sell was not confirmed by a fall below the lower moving average band shown on Figure 1. 2. The inside moving average band. This band is a 15-period simple moving average offset by 2% on either side. A move below the lower band suggests a sell signal. 3. Elliott wave count. The wave count shown suggests that the stock could be in a wave 4th retracement. The chart suggests a 36% probability of wave 4 down being completed as forecast, with an upside target of $131.47. 4. The volume is above the average, the redline rising as the price rises, a sign of strength, and falling as the price falls, also a sign of strength. 5. Finally, as long as the price remains above the trendline and as long as the Dow Jones Industrial Average (DJIA) remains positive, this is a share worth buying and, according to Cramer, holding. To conclude. I do not like buying a stock that has no history. Past performance is the basis of technical analysis, but VMWare Inc. is an exception. |
Has been a technical analyst since 1969, and has worked as a futures and options trader with First Financial Futures in Johannesburg, South Africa.
| Address: | 3256 West 24th Ave |
| Vancouver, BC | |
| Phone # for sales: | 6042634214 |
| E-mail address: | petroosp@gmail.com |
Click here for more information about our publications!
PRINT THIS ARTICLE

Request Information From Our Sponsors
- VectorVest, Inc.
- Executive Premier Workshop
- One-Day Options Course
- OptionsPro
- Retirement Income Workshop
- Sure-Fire Trading Systems (VectorVest, Inc.)
- Trading as a Business Workshop
- VectorVest 7 EOD
- VectorVest 7 RealTime/IntraDay
- VectorVest AutoTester
- VectorVest Educational Services
- VectorVest OnLine
- VectorVest Options Analyzer
- VectorVest ProGraphics v6.0
- VectorVest ProTrader 7
- VectorVest RealTime Derby Tool
- VectorVest Simulator
- VectorVest Variator
- VectorVest Watchdog
- StockCharts.com, Inc.
- Candle Patterns
- Candlestick Charting Explained
- Intermarket Technical Analysis
- John Murphy on Chart Analysis
- John Murphy's Chart Pattern Recognition
- John Murphy's Market Message
- MurphyExplainsMarketAnalysis-Intermarket Analysis
- MurphyExplainsMarketAnalysis-Visual Analysis
- StockCharts.com
- Technical Analysis of the Financial Markets
- The Visual Investor
