HOT TOPICS LIST
- MACD
- Fibonacci
- RSI
- Gann
- ADXR
- Stochastics
- Volume
- Triangles
- Futures
- Cycles
- Volatility
- ZIGZAG
- MESA
- Retracement
- Aroon
INDICATORS LIST
LIST OF TOPICS
PRINT THIS ARTICLE
by David Penn
As Big Blue rebounds from lows not seen since 1999, the bears are the ones being voted off this island.
Position: N/A
David Penn
Technical Writer for Technical Analysis of STOCKS & COMMODITIES magazine, Working-Money.com, and Traders.com Advantage.
PRINT THIS ARTICLE
ISLAND REVERSAL
IBM's Island Reversals
01/31/01 01:27:24 PMby David Penn
As Big Blue rebounds from lows not seen since 1999, the bears are the ones being voted off this island.
Position: N/A
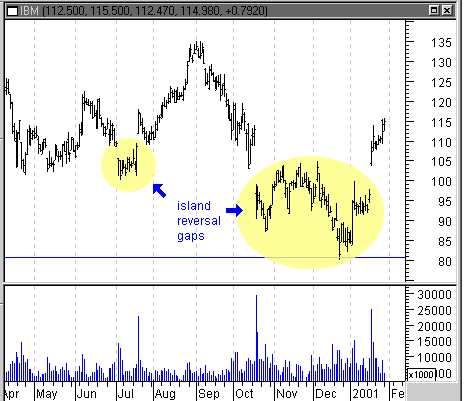
| If investors and traders can fall in love with certain securities, then I wonder whether or not securities can fall in love with certain chart patterns. Reading about the "Great Tech Recovery of 2001" had me searching for technology stocks that might be benefiting from a better-than-benign January. Big Blue more than fits the list. IBM [NYSE: IBM] had been in a DJIA-like top consolidation pattern for all of 2000, oscillating between $139 and $101 for most of the year. In October, IBM shares gapped down severely, setting the stage for a major low of $80 reached in December. This October gap became the first, or left, side of an island reversal gap, as IBM shares rallied strongly in January 2001, gapping up with even more vigor than when prices gapped down. From the low of $80 in late December, IBM shares closed at $115 in late January. |
| The island reversal gap (shown are bottom, or bullish, variations) occurs when prices gap down, consolidate for a period, then gap back up--often to approximately the same position as before the first gap down. Here, the initial gap down in October was $8 per share. The gap up in January was $16 per share. The volume trend during island reversal gaps is downward, generally, which makes intuitive sense given the large volumes that tend to accompany price gaps. The volume pattern in IBM here is almost perfect, with strong volumes on both the gap down and the gap up, and relatively weak volumes in between. |

|
| Island reversal gaps have anticipated two rallies for IBM shares. |
| Graphic provided by: MetaStock. |
| |
| As an island reversal gap, the present formation portends up to three months of bullish price action. Where might IBM be three months from now? The measurement rule for island reversal gaps is like the measurement rule for many chart patterns: take the formation height and add it to the highest high in the formation (bearish or top formations tend to do the opposite, taking the formation height and subtracting it from the lowest low in the formation). This would provide for a formation height of 24.75 (the highest high, reached December 5, was 104.75, and the lowest low of the formation, reached December 21, was 80) which, added to the highest high of the formation, yields an upside price objective of $129.50 per share and a potential, post-breakout gain of nearly 24%. |
| The October-January island reversal gap in IBM is prominent. But there was a small island reversal gap in July 2000. While not part of even an intermediate bottom, the July 2000 island reversal gap occurred as IBM was testing lows from earlier in the year. The July island reversal gap helped anticipate the September rally that took IBM to a high of $133 at the end of August (the price objective from the July island reversal gap was only about $119, a 9% advance after breakout). |
Technical Writer for Technical Analysis of STOCKS & COMMODITIES magazine, Working-Money.com, and Traders.com Advantage.
| Title: | Technical Writer |
| Company: | Technical Analysis, Inc. |
| Address: | 4757 California Avenue SW |
| Seattle, WA 98116 | |
| Phone # for sales: | 206 938 0570 |
| Fax: | 206 938 1307 |
| Website: | www.Traders.com |
| E-mail address: | DPenn@traders.com |
Traders' Resource Links | |
| Charting the Stock Market: The Wyckoff Method -- Books | |
| Working-Money.com -- Online Trading Services | |
| Traders.com Advantage -- Online Trading Services | |
| Technical Analysis of Stocks & Commodities -- Publications and Newsletters | |
| Working Money, at Working-Money.com -- Publications and Newsletters | |
| Traders.com Advantage -- Publications and Newsletters | |
| Professional Traders Starter Kit -- Software | |
Click here for more information about our publications!
Comments

|

Request Information From Our Sponsors
- StockCharts.com, Inc.
- Candle Patterns
- Candlestick Charting Explained
- Intermarket Technical Analysis
- John Murphy on Chart Analysis
- John Murphy's Chart Pattern Recognition
- John Murphy's Market Message
- MurphyExplainsMarketAnalysis-Intermarket Analysis
- MurphyExplainsMarketAnalysis-Visual Analysis
- StockCharts.com
- Technical Analysis of the Financial Markets
- The Visual Investor
- VectorVest, Inc.
- Executive Premier Workshop
- One-Day Options Course
- OptionsPro
- Retirement Income Workshop
- Sure-Fire Trading Systems (VectorVest, Inc.)
- Trading as a Business Workshop
- VectorVest 7 EOD
- VectorVest 7 RealTime/IntraDay
- VectorVest AutoTester
- VectorVest Educational Services
- VectorVest OnLine
- VectorVest Options Analyzer
- VectorVest ProGraphics v6.0
- VectorVest ProTrader 7
- VectorVest RealTime Derby Tool
- VectorVest Simulator
- VectorVest Variator
- VectorVest Watchdog
