HOT TOPICS LIST
- MACD
- Fibonacci
- RSI
- Gann
- ADXR
- Stochastics
- Volume
- Triangles
- Futures
- Cycles
- Volatility
- ZIGZAG
- MESA
- Retracement
- Aroon
INDICATORS LIST
LIST OF TOPICS
PRINT THIS ARTICLE
by David Penn
January lumber futures retest contract lows in October.
Position: N/A
David Penn
Technical Writer for Technical Analysis of STOCKS & COMMODITIES magazine, Working-Money.com, and Traders.com Advantage.
PRINT THIS ARTICLE
REVERSAL
Will Lumber Find A Soft Landing?
10/12/07 03:54:46 PMby David Penn
January lumber futures retest contract lows in October.
Position: N/A
| The last time I wrote about lumber futures for Traders.com was back in May of this year. At the time, in an article titled "A Lift In Lumber" (Traders.com Advantage, May 24, 2007), I was highlighting a bottom and reversal in lumber futures, which had been in decline since peaking at around $320 in early January. The bear market lasted until mid-May when, as I wrote, positive divergences in the moving average convergence/divergence (MACD) histogram and the stochastic indicated that downside momentum was ebbing. |
| Equally important to lumber traders was the fact that shortly after the market began moving higher in the wake of those positive divergences, the stochastic became overbought. This is one of my favorite moments in a market: When a positive divergence off of a bottom is followed by a stochastic breakout (that is, the stochastic crossing above 80 and into overbought territory). As I have mentioned many times before, this is often an excellent opportunity for the long-side trader to strike. |
| That rally in lumber futures allowed traders to ride the market higher from a confirmed close on May 22 at 269.10 to approximately 277.50 on the close five trading days later (basis July). That was a gain worth some 840 points or approximately $924 per contract. Lumber futures again topped in mid-June. This top, as I wrote in an article for Working-Money.com, was well telegraphed by again both the stochastic and the MACD histogram. And after falling for the balance of the summer, lumber futures have again come to the point where traders can again consider going long. |

|
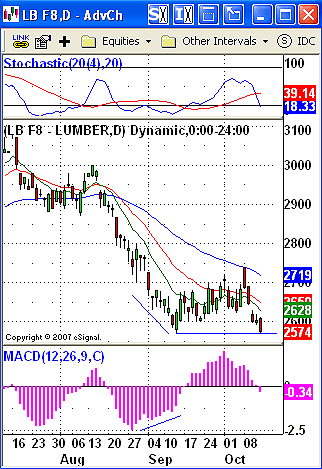
| FIGURE 1: LUMBER, JANUARY FUTURES, DAILY. The upwardly sloping MACD histogram in late August and the first half of September helped warn traders that downside momentum was fading in the market for January lumber. |
| Graphic provided by: eSignal. |
| |
| Emphasis on "consider." Once again the positive divergences in the MACD histogram and the stochastic are warning that momentum to the downside was waning over the course as September came and went. In addition, the size of the MACD histogram during the bounce in October — while not as impressive as the bounce in May that led to the rally mentioned above — still is the sort of thing that often precedes a retest of the lows and a resumption of the move higher. |
| The stochastic is the key indicator for me here. While the MACD histogram and the stochastic have indicated that the momentum to the downside has ceased, that is not the same thing as saying there is significant momentum to the upside. Indeed, a trade based on the positive divergence in the MACD histogram alone would have resulted in painful drawdowns as a trader buying the confirmed close on September 25 at 268.50 would have suffered a reversal almost immediately with the following day's intraday low of 262.50 (600 points or $660 per contract). What would be indicative of upside momentum would be a stochastic moving from "normal" territory to becoming overbought — and in pretty much the same fashion as the stochastic did in lumber futures back in May. |
Technical Writer for Technical Analysis of STOCKS & COMMODITIES magazine, Working-Money.com, and Traders.com Advantage.
| Title: | Technical Writer |
| Company: | Technical Analysis, Inc. |
| Address: | 4757 California Avenue SW |
| Seattle, WA 98116 | |
| Phone # for sales: | 206 938 0570 |
| Fax: | 206 938 1307 |
| Website: | www.Traders.com |
| E-mail address: | DPenn@traders.com |
Traders' Resource Links | |
| Charting the Stock Market: The Wyckoff Method -- Books | |
| Working-Money.com -- Online Trading Services | |
| Traders.com Advantage -- Online Trading Services | |
| Technical Analysis of Stocks & Commodities -- Publications and Newsletters | |
| Working Money, at Working-Money.com -- Publications and Newsletters | |
| Traders.com Advantage -- Publications and Newsletters | |
| Professional Traders Starter Kit -- Software | |
Click here for more information about our publications!
Comments

Request Information From Our Sponsors
- StockCharts.com, Inc.
- Candle Patterns
- Candlestick Charting Explained
- Intermarket Technical Analysis
- John Murphy on Chart Analysis
- John Murphy's Chart Pattern Recognition
- John Murphy's Market Message
- MurphyExplainsMarketAnalysis-Intermarket Analysis
- MurphyExplainsMarketAnalysis-Visual Analysis
- StockCharts.com
- Technical Analysis of the Financial Markets
- The Visual Investor
- VectorVest, Inc.
- Executive Premier Workshop
- One-Day Options Course
- OptionsPro
- Retirement Income Workshop
- Sure-Fire Trading Systems (VectorVest, Inc.)
- Trading as a Business Workshop
- VectorVest 7 EOD
- VectorVest 7 RealTime/IntraDay
- VectorVest AutoTester
- VectorVest Educational Services
- VectorVest OnLine
- VectorVest Options Analyzer
- VectorVest ProGraphics v6.0
- VectorVest ProTrader 7
- VectorVest RealTime Derby Tool
- VectorVest Simulator
- VectorVest Variator
- VectorVest Watchdog
