HOT TOPICS LIST
- MACD
- Fibonacci
- RSI
- Gann
- ADXR
- Stochastics
- Volume
- Triangles
- Futures
- Cycles
- Volatility
- ZIGZAG
- MESA
- Retracement
- Aroon
INDICATORS LIST
LIST OF TOPICS
PRINT THIS ARTICLE
by Arthur Hill
After a long consolidation, FTI Consulting is showing signs of life and continuation higher looks imminent.
Position: Accumulate
Arthur Hill
Arthur Hill is currently editor of TDTrader.com, a website specializing in trading strategies, sector/industry specific breadth stats and overall technical analysis. He passed the Society of Technical Analysts (STA London) diploma exam with distinction is a Certified Financial Technician (CFTe). Prior to TD Trader, he was the Chief Technical Analyst for Stockcharts.com and the main contributor to the ChartSchool.
PRINT THIS ARTICLE
RSI
FTI Consulting Takes A Long Rest
10/12/07 01:04:04 PMby Arthur Hill
After a long consolidation, FTI Consulting is showing signs of life and continuation higher looks imminent.
Position: Accumulate
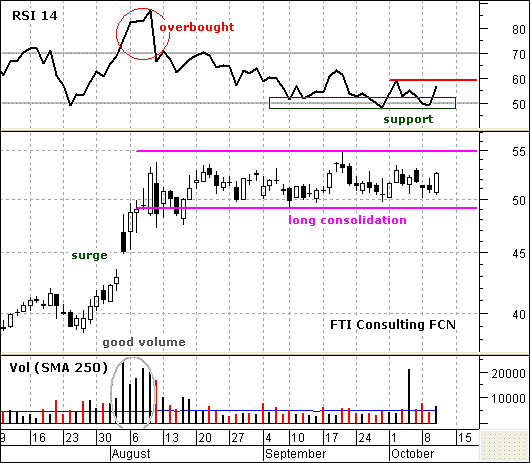
| On the price chart, FTI Consulting (FCN) surged to new highs in early August and then embarked on a long consolidation (Figure 1). The surge lasted from July 26 to August 9 (11 days), and the consolidation is going on 45 days as of now. The stock advanced over 30% and it takes a while to digest such big gains. This consolidation represents a rest after the big move and a continuation higher is expected. |
| The surge occurred on expanding volume and this lends validity to the advance. Volume during the consolidation subsided as trading returned to normal. I am starting to see an uptick in volume again with two high-volume up days over the past five days. Interest is picking up, and it is time to watch the consolidation boundaries for a breakout. A move above 55 would be bullish and signal a continuation higher. A move below 49 would be bearish and argue for a correction. Because the prior move was up with strong volume, the odds favor a continuation higher and an upside breakout. |

|
| FIGURE 1: FCN. FTI Consulting surged to new highs in early August and then embarked on a long consolidation. |
| Graphic provided by: MetaStock. |
| |
| The top indicator window shows a 14-day relative strength index (RSI). The indicator became overbought in early August with the move above 70. As the stock consolidated, the RSI moved back toward its centerline (50). This makes sense because flat trading means flat momentum; the 50 centerline acts as support in an uptrend and the RSI is firming in this area. A break above 60 would trigger a breakout in the RSI and turn momentum bullish. |
Arthur Hill is currently editor of TDTrader.com, a website specializing in trading strategies, sector/industry specific breadth stats and overall technical analysis. He passed the Society of Technical Analysts (STA London) diploma exam with distinction is a Certified Financial Technician (CFTe). Prior to TD Trader, he was the Chief Technical Analyst for Stockcharts.com and the main contributor to the ChartSchool.
| Title: | Editor |
| Company: | TDTrader.com |
| Address: | Willem Geetsstraat 17 |
| Mechelen, B2800 | |
| Phone # for sales: | 3215345465 |
| Website: | www.tdtrader.com |
| E-mail address: | arthurh@tdtrader.com |
Traders' Resource Links | |
| TDTrader.com has not added any product or service information to TRADERS' RESOURCE. | |
Click here for more information about our publications!
PRINT THIS ARTICLE

Request Information From Our Sponsors
- StockCharts.com, Inc.
- Candle Patterns
- Candlestick Charting Explained
- Intermarket Technical Analysis
- John Murphy on Chart Analysis
- John Murphy's Chart Pattern Recognition
- John Murphy's Market Message
- MurphyExplainsMarketAnalysis-Intermarket Analysis
- MurphyExplainsMarketAnalysis-Visual Analysis
- StockCharts.com
- Technical Analysis of the Financial Markets
- The Visual Investor
- VectorVest, Inc.
- Executive Premier Workshop
- One-Day Options Course
- OptionsPro
- Retirement Income Workshop
- Sure-Fire Trading Systems (VectorVest, Inc.)
- Trading as a Business Workshop
- VectorVest 7 EOD
- VectorVest 7 RealTime/IntraDay
- VectorVest AutoTester
- VectorVest Educational Services
- VectorVest OnLine
- VectorVest Options Analyzer
- VectorVest ProGraphics v6.0
- VectorVest ProTrader 7
- VectorVest RealTime Derby Tool
- VectorVest Simulator
- VectorVest Variator
- VectorVest Watchdog
