HOT TOPICS LIST
- MACD
- Fibonacci
- RSI
- Gann
- ADXR
- Stochastics
- Volume
- Triangles
- Futures
- Cycles
- Volatility
- ZIGZAG
- MESA
- Retracement
- Aroon
INDICATORS LIST
LIST OF TOPICS
PRINT THIS ARTICLE
by David Penn
Overbought markets continue to bring gains to early adopters.
Position: N/A
David Penn
Technical Writer for Technical Analysis of STOCKS & COMMODITIES magazine, Working-Money.com, and Traders.com Advantage.
PRINT THIS ARTICLE
BREAKOUTS
BOSO Plays In The Diamonds And QQQQs Keep Climbing
10/10/07 09:44:27 AMby David Penn
Overbought markets continue to bring gains to early adopters.
Position: N/A
| One of the most interesting things I've come to understand about markets in recent years is not only that overbought markets tend to stay overbought, but also that taking a position as soon as a market becomes overbought can be the best way to exploit these conditions. |
| I called this approach "BOSO" for "buying overbought/selling oversold" in an article I wrote for Working-Money.com back in October 2005. The BOSO approach owes much to both the work done on overbought and oversold markets by Price Headley of BigTrends.com as well as Jake Bernstein's notion of the stochastic pop. Let's take a look at two widely traded equity markets, the Dow diamonds and the NASDAQ 100 QQQQs, and see how the most recent BOSO buy signals in the daily charts are faring. |

|
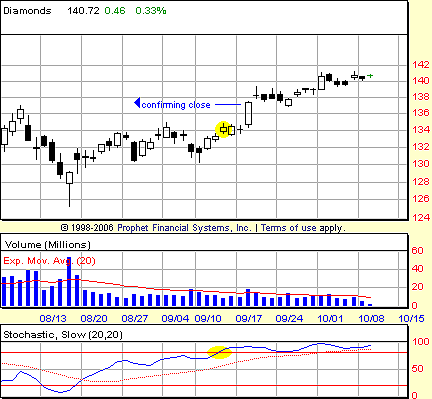
| FIGURE 1: DOW DIAMONDS, DAILY. The highlighted oval in the lowermost panel shows the moment the stochastic became overbought (that is, above 80). The highlighted oval in the price panel reflects the session during which the stochastic breakout occurred. When the market closed above the high of this breakout session, the signal was confirmed. |
| Graphic provided by: Prophet Financial, Inc. |
| |
| The chart of the Dow diamonds in Figure 1 shows a perfect BOSO entry to the upside. The stochastic becomes overbought as of the end of the September 13th session, with the DIA closing at 134.30. This BOSO buy signal is confirmed if and when the market closes above the high of that session, which was a few cents higher at 134.78. When the market made this confirming, follow-through close three trading days later on September 18, traders following the signal could confidently take a position as of the close of that confirmation session at 137.35. The market for the Dow diamonds has since traded as high as 140.68 on a closing basis. A similar opportunity was available in the market for the NASDAQ 100's QQQQs. |

|
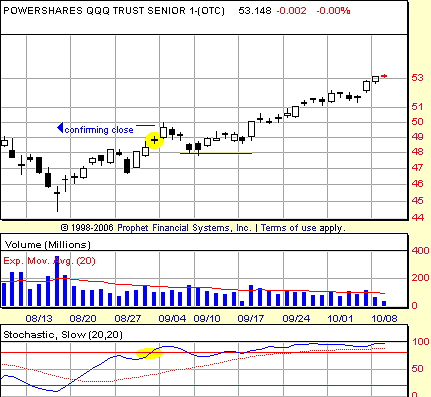
| FIGURE 2: POWERSHARES QQQ TRUST (QQQQ), DAILY. Highlighted ovals in the indicator and price panels reflect where the stochastic became overbought in late August. The confirming close is also indicated. Note how the market corrected shortly after entry, as the stochastic slipped from the overbought range. The fact that the market never confirmed this breakdown with a lower close helped traders remain in the trade as the market found support and resumed its ascent. |
| Graphic provided by: Prophet Financial, Inc. |
| |
| This BOSO entry in the QQQQ (Figure 2) is similar to the one in the Dow diamonds. The stochastic becomes overbought, and a confirming close is made shortly afterward. What is interesting about this situation is how the market corrected shortly after the entry. This correction -- which took the QQQQ from the confirming close at 49.68 to a maximum drawdown of 1.87 with an intraday drop to 47.81 -- saw the stochastic slip out of the overbought "greed zone." It is important to note, however, the market for QQQQ never closed below the low of the session, during which the stochastic moved out of the overbought area. |
| In other words, there was no "confirming close" when the stochastic moved back below the overbought threshold. This lack of follow-through allowed traders to maintain the position, which rebounded shortly afterward. At its most recent close, the QQQQ were trading at 53.15 -- nearly three and a half points above the price of the confirming close back in early September. |
Technical Writer for Technical Analysis of STOCKS & COMMODITIES magazine, Working-Money.com, and Traders.com Advantage.
| Title: | Technical Writer |
| Company: | Technical Analysis, Inc. |
| Address: | 4757 California Avenue SW |
| Seattle, WA 98116 | |
| Phone # for sales: | 206 938 0570 |
| Fax: | 206 938 1307 |
| Website: | www.Traders.com |
| E-mail address: | DPenn@traders.com |
Traders' Resource Links | |
| Charting the Stock Market: The Wyckoff Method -- Books | |
| Working-Money.com -- Online Trading Services | |
| Traders.com Advantage -- Online Trading Services | |
| Technical Analysis of Stocks & Commodities -- Publications and Newsletters | |
| Working Money, at Working-Money.com -- Publications and Newsletters | |
| Traders.com Advantage -- Publications and Newsletters | |
| Professional Traders Starter Kit -- Software | |
Click here for more information about our publications!
PRINT THIS ARTICLE

Request Information From Our Sponsors
- StockCharts.com, Inc.
- Candle Patterns
- Candlestick Charting Explained
- Intermarket Technical Analysis
- John Murphy on Chart Analysis
- John Murphy's Chart Pattern Recognition
- John Murphy's Market Message
- MurphyExplainsMarketAnalysis-Intermarket Analysis
- MurphyExplainsMarketAnalysis-Visual Analysis
- StockCharts.com
- Technical Analysis of the Financial Markets
- The Visual Investor
- VectorVest, Inc.
- Executive Premier Workshop
- One-Day Options Course
- OptionsPro
- Retirement Income Workshop
- Sure-Fire Trading Systems (VectorVest, Inc.)
- Trading as a Business Workshop
- VectorVest 7 EOD
- VectorVest 7 RealTime/IntraDay
- VectorVest AutoTester
- VectorVest Educational Services
- VectorVest OnLine
- VectorVest Options Analyzer
- VectorVest ProGraphics v6.0
- VectorVest ProTrader 7
- VectorVest RealTime Derby Tool
- VectorVest Simulator
- VectorVest Variator
- VectorVest Watchdog
