HOT TOPICS LIST
- MACD
- Fibonacci
- RSI
- Gann
- ADXR
- Stochastics
- Volume
- Triangles
- Futures
- Cycles
- Volatility
- ZIGZAG
- MESA
- Retracement
- Aroon
INDICATORS LIST
LIST OF TOPICS
PRINT THIS ARTICLE
by Chaitali Mohile
New high on Amazon stock was achieved with reducing volume and slow price momentum.
Position: N/A
Chaitali Mohile
Active trader in the Indian stock markets since 2003 and a full-time writer. Trading is largely based upon technical analysis.
PRINT THIS ARTICLE
VOLUME
Amazon.com Climbs Up On Lower Volume, Overheated ADX
10/12/07 12:57:18 PMby Chaitali Mohile
New high on Amazon stock was achieved with reducing volume and slow price momentum.
Position: N/A
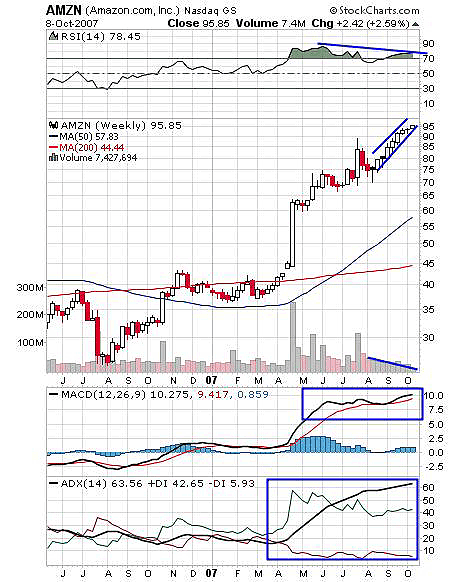
| For a rally or breakout to sustain healthy volume, support is of utmost importance. The absence of encouraging volume can weaken any directional movement and later can result in pattern failure. In the case of Amazon, the upside journey geared up from 75 and gradually reached a high of 95. The 20-point journey was not encouraging; at every higher price the volume was reducing and price movement slowed down too. See Figure 1; the size of candles turned smaller as the rally moved ahead, replicating the weak price action. Also note the rising wedge that was formed due to the poor upward rally. Remember, a rising wedge is a bearish formation resulting in a minor dip. |
| In addition, the trend indicator is highly overheated. Average directional movement index (ADX)(14) is considered overheated above 40 and can stretch to a maximum of 60. As the trend reaches 60 or above, the threat of a trend reversal or a stop in the trend appears. In Figure 1, the ADX (14) has reached 63 so there is a strong chance of some downfall while the indicator starts declining. The action hasn't started yet, but it is time to lighten your positions. |

|
| FIGURE 1: AMZN, WEEKLY. The rising wedge and highly overheated ADX (14) can bring minor correction in the stock. |
| Graphic provided by: StockCharts.com. |
| |
| Earlier, the relative strength index (RSI) was highly overbought around 90 and price was much lower. Now price has moved to new highs, but the RSI (14) has lower highs, so there is a negative divergence on the indicator. Though this indicator can remain overbought for a longer period, the overall move shows a weak bullish rally lies ahead. The moving average convergence/divergence (MACD)(12,26,9) is strong and positive. But we cannot rely only on a single positive indicator when the other two are pointing to a weakness in the rally. |
| I would recommend lightening up your position and remain low leveraged on the stock. The correction may not end up being too sharp, but the weak indicators and low volume suggest some change in price momentum. |
Active trader in the Indian stock markets since 2003 and a full-time writer. Trading is largely based upon technical analysis.
| Company: | Independent |
| Address: | C1/3 Parth Indraprasth Towers. Vastrapur |
| Ahmedabad, Guj 380015 | |
| E-mail address: | chaitalimohile@yahoo.co.in |
Traders' Resource Links | |
| Independent has not added any product or service information to TRADERS' RESOURCE. | |
Click here for more information about our publications!
Comments
Date: 10/13/07Rank: 3Comment:

Request Information From Our Sponsors
- StockCharts.com, Inc.
- Candle Patterns
- Candlestick Charting Explained
- Intermarket Technical Analysis
- John Murphy on Chart Analysis
- John Murphy's Chart Pattern Recognition
- John Murphy's Market Message
- MurphyExplainsMarketAnalysis-Intermarket Analysis
- MurphyExplainsMarketAnalysis-Visual Analysis
- StockCharts.com
- Technical Analysis of the Financial Markets
- The Visual Investor
- VectorVest, Inc.
- Executive Premier Workshop
- One-Day Options Course
- OptionsPro
- Retirement Income Workshop
- Sure-Fire Trading Systems (VectorVest, Inc.)
- Trading as a Business Workshop
- VectorVest 7 EOD
- VectorVest 7 RealTime/IntraDay
- VectorVest AutoTester
- VectorVest Educational Services
- VectorVest OnLine
- VectorVest Options Analyzer
- VectorVest ProGraphics v6.0
- VectorVest ProTrader 7
- VectorVest RealTime Derby Tool
- VectorVest Simulator
- VectorVest Variator
- VectorVest Watchdog
