HOT TOPICS LIST
- MACD
- Fibonacci
- RSI
- Gann
- ADXR
- Stochastics
- Volume
- Triangles
- Futures
- Cycles
- Volatility
- ZIGZAG
- MESA
- Retracement
- Aroon
INDICATORS LIST
LIST OF TOPICS
PRINT THIS ARTICLE
by Chaitali Mohile
XLK is undergoing healthy consolidation at all-time highs, leading to a bullish rally.
Position: Buy
Chaitali Mohile
Active trader in the Indian stock markets since 2003 and a full-time writer. Trading is largely based upon technical analysis.
PRINT THIS ARTICLE
FLAGS AND PENNANTS
Technology Select Sector Consolidating At New Levels
10/10/07 12:17:09 PMby Chaitali Mohile
XLK is undergoing healthy consolidation at all-time highs, leading to a bullish rally.
Position: Buy
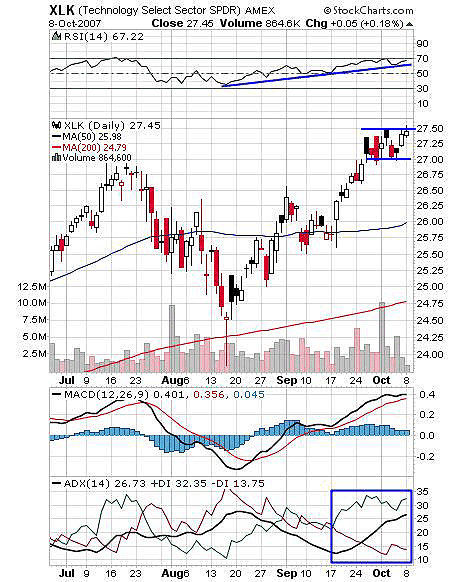
| During the declining rally in July-August, support was established around 24.50, marking a low below the 200-day moving average support at approximately 24. The upside move from 24.50 gradually climbed above the 50-day moving average resistance. The rally, though, was not on heavy volume; it managed to reach 26.50 and sustain above the 50-day moving average support. On this newly formed support, Technology Select Sector SPDR (XLK) went through a volatile period under the pressure of the previous high. In the recent few weeks, the entire market witnessed a pullback rally and helped XLK fill its basket, making an all-time high at 27.50. This advance rally gained $1.50 and opened doors for fresh buying opportunities for traders. |
| With this advance, the sector has now entered consolidation. In Figure 1, the sideways move is very narrow with the lower support at 72 and the upper range at 27.50. Consolidation is a healthy period, and provides an opportunity for traders to review their positions. The consolidation breakout carries tremendous strength for directional movement. Similarly, as XLK moves out of this sideways move, fresh upside rally will begin. |

|
| FIGURE 1: XLK, DAILY. The flag & pennant breakout will lead the rally to $29. All three indicators have bullish force and therefore can make the breakout successful. |
| Graphic provided by: StockCharts.com. |
| |
| Let's find whether the oscillators are supportive of the upside breakout. The average directional movement index (ADX)(14) shows a well-developed trend. The relative strength index (RSI)(14) has moved steadily upward, indicating bullish strength in the entire rally and also points to stability in a further upside rally. The moving average convergence/divergence (MACD)(12,26,9) is positive and therefore reconfirms a high possibility of an upside breakout. It is very difficult to estimate the length of the consolidation period, so a breakout is necessary for confirmation. I would therefore recommend traders to go long above $27.50 with the calculated target of $29. This minimum level is measured on the basis of the length of the flagpole or the length of the advance rally. So by adding 1.5 to 27.50 (breakout level), we get a fresh target of $29. |

|
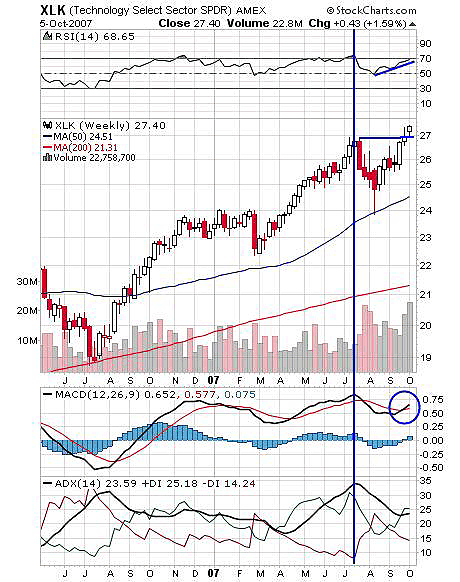
| FIGURE 2: XLK, WEEKLY. XLK has established strong support on a previous high, enabling the rally to move ahead. In addition, the RSI (14) and the MACD (12,26,9) are on their way to previous highs. |
| Graphic provided by: StockCharts.com. |
| |
| On the weekly chart (Figure 2), XLK has crossed the previous resistance at 27 and has established strong support there. The important signal I noticed here is a divergence on the indicators. Previously, at the higher level of 27, the RSI (14) was overbought, marginally moving above 70. The MACD (12,26,9), after the bullish crossover, remained positive moving around 0.75 level. The present scenario is different in that price made a new high but the indicators are in the process of reaching higher levels. The RSI (14) moved closer to 70, so that's a positive indication. In addition, the MACD (12,26,9) is about to show a bullish crossover, again supporting the breakout. But since these indicators failed to move to higher levels along with price, the consolidation period may last longer. However, the trend is developing in favor of bulls, so the upside breakout is inevitable. |
| Traders can watch for price action before undergoing any trade. Only a confirmed breakout above 27.50 can be good buying opportunity. |
Active trader in the Indian stock markets since 2003 and a full-time writer. Trading is largely based upon technical analysis.
| Company: | Independent |
| Address: | C1/3 Parth Indraprasth Towers. Vastrapur |
| Ahmedabad, Guj 380015 | |
| E-mail address: | chaitalimohile@yahoo.co.in |
Traders' Resource Links | |
| Independent has not added any product or service information to TRADERS' RESOURCE. | |
Click here for more information about our publications!
PRINT THIS ARTICLE

Request Information From Our Sponsors
- StockCharts.com, Inc.
- Candle Patterns
- Candlestick Charting Explained
- Intermarket Technical Analysis
- John Murphy on Chart Analysis
- John Murphy's Chart Pattern Recognition
- John Murphy's Market Message
- MurphyExplainsMarketAnalysis-Intermarket Analysis
- MurphyExplainsMarketAnalysis-Visual Analysis
- StockCharts.com
- Technical Analysis of the Financial Markets
- The Visual Investor
- VectorVest, Inc.
- Executive Premier Workshop
- One-Day Options Course
- OptionsPro
- Retirement Income Workshop
- Sure-Fire Trading Systems (VectorVest, Inc.)
- Trading as a Business Workshop
- VectorVest 7 EOD
- VectorVest 7 RealTime/IntraDay
- VectorVest AutoTester
- VectorVest Educational Services
- VectorVest OnLine
- VectorVest Options Analyzer
- VectorVest ProGraphics v6.0
- VectorVest ProTrader 7
- VectorVest RealTime Derby Tool
- VectorVest Simulator
- VectorVest Variator
- VectorVest Watchdog
