HOT TOPICS LIST
- MACD
- Fibonacci
- RSI
- Gann
- ADXR
- Stochastics
- Volume
- Triangles
- Futures
- Cycles
- Volatility
- ZIGZAG
- MESA
- Retracement
- Aroon
INDICATORS LIST
LIST OF TOPICS
PRINT THIS ARTICLE
by Chaitali Mohile
After long volatile sessions in earlier months, EWO finally breaks through the hurdles and creates good trading conditions.
Position: Buy
Chaitali Mohile
Active trader in the Indian stock markets since 2003 and a full-time writer. Trading is largely based upon technical analysis.
PRINT THIS ARTICLE
SUPPORT & RESISTANCE
Austria I-Share Leaves Behind Clouds Of Uncertainty
10/09/07 01:40:58 PMby Chaitali Mohile
After long volatile sessions in earlier months, EWO finally breaks through the hurdles and creates good trading conditions.
Position: Buy
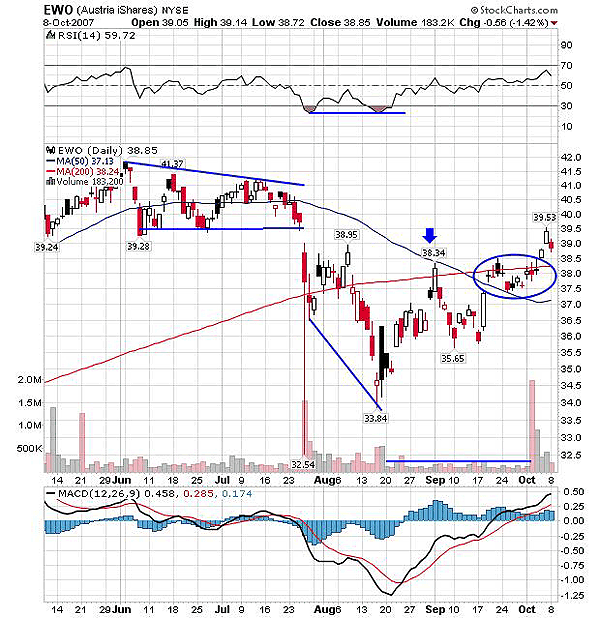
| The large number of red candles in the chart in Figure 1 show the high volatility and selling pressure in the Austria i-share (EWO). Moreover, the gap down from a wide-range consolidation was a clue for further downfall. With the support of a 200-day moving average, EWO tried to consolidate and rush upward. But another gap down encouraged bears, gradually dragging down the stock to the lowest level of 33.84. Now the bulls had two strong resistances, the 50-day and the 200-day moving average. The first pullback rally towards these resistances failed and the higher low at 35.64 was formed. The bearish moving average crossovers weaken the stock further, so the pullback cooled off a bit. |

|
| FIGURE 1: EWO, DAILY. The Austria i-Share has violated a 200-day moving average resistance and is headed toward previous highs. The stop-loss of 38 is necessary during this trade. |
| Graphic provided by: StockCharts.com. |
| |
| The upside move lost its steam as can be seen by the cluster of dojis. The rally was trapped between the 50-day MA support and the 200-day MA resistance. The breakout from this area was important to bring back trader confidence. If you look at the chart you see that price moved to a lower low from 36.5 to 33.84. At this time a double bottom formed on the RSI (14) (oversold at same level). The RSI (14) began its upward rally and gained the bullish strength steadily as it moved above 50 levels. Meanwhile, the moving average convergence/divergence (MACD) (12,26,9) also climbed into positive territory, forming a new high. Therefore, the buying pressure was seen increasing as the price moved out of the support/resistance area. |
| With the newly formed 200-day MA support and on positive indicators, the price made a high of 39.53 on breakout. The previous high of 38.95 was violated, and therefore, traders got a fresh buying opportunity above 39.53 with a stop-loss at 38. Here, the stop-loss is very important, as the volume still stands below satisfaction and can drag the price back to 50-day MA support. So for a low-risk trade, keeping a tight stop-loss will prevent whipsaws. |

|
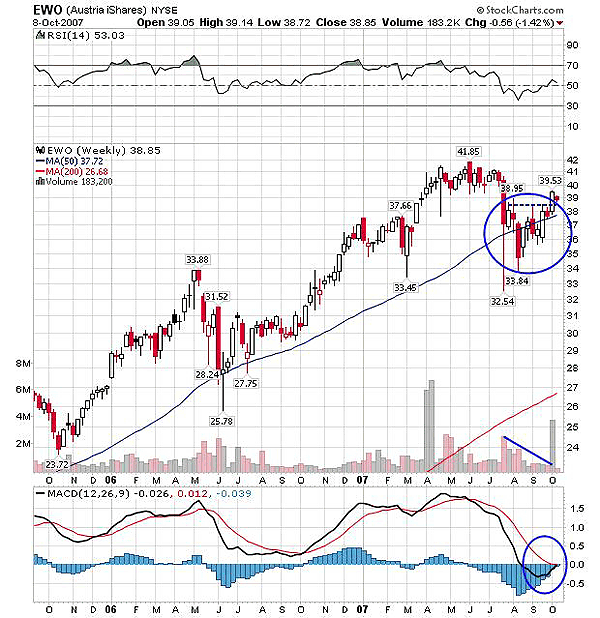
| FIGURE 2: EWO, WEEKLY. The 50-day moving average offered strong support to the bullish rally. |
| Graphic provided by: StockCharts.com. |
| |
| On the weekly chart (Figure 2), the 50-day MA has been a shield during a volatile session in the past. Only the July turbulence drifted the stock below the 50-day MA support. The present rally also began with the same support as before. The stop-loss gives a higher weight on the weekly chart, as the 50-day MA support is close to 38 levels. Both indicators suggest the successful breakout as the RSI (14) has good support at the 50 level and the MACD (12,26,9) is on its way to positive territory with a bullish crossover. |
| Traders can go long above 39.53, following a strict stop-loss at 38. |
Active trader in the Indian stock markets since 2003 and a full-time writer. Trading is largely based upon technical analysis.
| Company: | Independent |
| Address: | C1/3 Parth Indraprasth Towers. Vastrapur |
| Ahmedabad, Guj 380015 | |
| E-mail address: | chaitalimohile@yahoo.co.in |
Traders' Resource Links | |
| Independent has not added any product or service information to TRADERS' RESOURCE. | |
Click here for more information about our publications!
PRINT THIS ARTICLE

Request Information From Our Sponsors
- StockCharts.com, Inc.
- Candle Patterns
- Candlestick Charting Explained
- Intermarket Technical Analysis
- John Murphy on Chart Analysis
- John Murphy's Chart Pattern Recognition
- John Murphy's Market Message
- MurphyExplainsMarketAnalysis-Intermarket Analysis
- MurphyExplainsMarketAnalysis-Visual Analysis
- StockCharts.com
- Technical Analysis of the Financial Markets
- The Visual Investor
- VectorVest, Inc.
- Executive Premier Workshop
- One-Day Options Course
- OptionsPro
- Retirement Income Workshop
- Sure-Fire Trading Systems (VectorVest, Inc.)
- Trading as a Business Workshop
- VectorVest 7 EOD
- VectorVest 7 RealTime/IntraDay
- VectorVest AutoTester
- VectorVest Educational Services
- VectorVest OnLine
- VectorVest Options Analyzer
- VectorVest ProGraphics v6.0
- VectorVest ProTrader 7
- VectorVest RealTime Derby Tool
- VectorVest Simulator
- VectorVest Variator
- VectorVest Watchdog
