HOT TOPICS LIST
- MACD
- Fibonacci
- RSI
- Gann
- ADXR
- Stochastics
- Volume
- Triangles
- Futures
- Cycles
- Volatility
- ZIGZAG
- MESA
- Retracement
- Aroon
INDICATORS LIST
LIST OF TOPICS
PRINT THIS ARTICLE
by David Penn
After a year and a half of soaring wheat prices, is the MACD histogram hinting at reversal?
Position: N/A
David Penn
Technical Writer for Technical Analysis of STOCKS & COMMODITIES magazine, Working-Money.com, and Traders.com Advantage.
PRINT THIS ARTICLE
REVERSAL
A Peak In Wheat? Negative Divergences Suggest A Turn In Early October
10/09/07 09:03:40 AMby David Penn
After a year and a half of soaring wheat prices, is the MACD histogram hinting at reversal?
Position: N/A
| The rally in wheat futures has been as impressive as any in the commodity markets in recent times. The last time I took a look at wheat futures for Traders.com Advantage was back in early August, when I wrote that a consolidation pattern looked likely to take what were then high wheat prices even higher ("The Wheat Diamond," August 8, 2007). |
| Then, I was looking at the September contract, trading at approximately $6.80. Since that time, wheat futures have only continued to climb, closing as high as $9.52-1/2 by earliest October (basis December futures). |

|
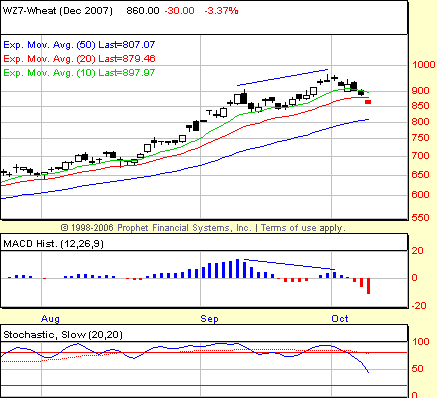
| FIGURE 1: WHEAT, DECEMBER FUTURES, DAILY. Negative divergences in both the MACD histogram and the stochastic helped traders anticipate a significant loss of momentum as wheat futures climbed higher into October. |
| Graphic provided by: Prophet Financial, Inc. |
| |
| The movement into October was accompanied by not one but two negative divergences: one in the stochastic and one in the moving average convergence/divergence (MACD) histogram. Recall that negative divergences occur when markets make new highs, yet key oscillators like the stochastic, the MACD histogram, or the TRIX fail to confirm them with new highs of their own. |
| The negative divergences in December wheat were classic (Figure 1). A price high in the first half of September was followed by a higher market price in early October. Yet in both instances, the MACD histogram and the stochastic were lower in October than in September. These negative divergences meant the momentum to the upside was waning in December wheat. It is important to note that these negative divergences become sell signals only when prices show the ability to move lower, not just the ability to "stop moving higher." What I like to do is use the session during which the MACD histogram retreats (from "M" to "m") or the stochastic hooks downward. This session is the "point" session. If the market closes beneath the low of this point session, then the negative divergence(s) are suitable for trading to the short side. If this follow-through does not occur, then I sit the opportunity out. |
| In this case we can see that our "point" session was on October 2. Although the stochastic hooked down a few days earlier, it was not confirmed by the MACD histogram until October 2. A short trade would be reasonable with a close below the low of October 2 — approximately $9.22-1/2. This close came two sessions later with a closing — and short entry — price of $9.06 on October 4. As of this writing, December wheat most recent close was at $8.60. That 46-cent difference was worth approximately $2,300 per contract. |
Technical Writer for Technical Analysis of STOCKS & COMMODITIES magazine, Working-Money.com, and Traders.com Advantage.
| Title: | Technical Writer |
| Company: | Technical Analysis, Inc. |
| Address: | 4757 California Avenue SW |
| Seattle, WA 98116 | |
| Phone # for sales: | 206 938 0570 |
| Fax: | 206 938 1307 |
| Website: | www.Traders.com |
| E-mail address: | DPenn@traders.com |
Traders' Resource Links | |
| Charting the Stock Market: The Wyckoff Method -- Books | |
| Working-Money.com -- Online Trading Services | |
| Traders.com Advantage -- Online Trading Services | |
| Technical Analysis of Stocks & Commodities -- Publications and Newsletters | |
| Working Money, at Working-Money.com -- Publications and Newsletters | |
| Traders.com Advantage -- Publications and Newsletters | |
| Professional Traders Starter Kit -- Software | |
Click here for more information about our publications!
Comments
Date: 04/29/08Rank: 5Comment:

Request Information From Our Sponsors
- StockCharts.com, Inc.
- Candle Patterns
- Candlestick Charting Explained
- Intermarket Technical Analysis
- John Murphy on Chart Analysis
- John Murphy's Chart Pattern Recognition
- John Murphy's Market Message
- MurphyExplainsMarketAnalysis-Intermarket Analysis
- MurphyExplainsMarketAnalysis-Visual Analysis
- StockCharts.com
- Technical Analysis of the Financial Markets
- The Visual Investor
- VectorVest, Inc.
- Executive Premier Workshop
- One-Day Options Course
- OptionsPro
- Retirement Income Workshop
- Sure-Fire Trading Systems (VectorVest, Inc.)
- Trading as a Business Workshop
- VectorVest 7 EOD
- VectorVest 7 RealTime/IntraDay
- VectorVest AutoTester
- VectorVest Educational Services
- VectorVest OnLine
- VectorVest Options Analyzer
- VectorVest ProGraphics v6.0
- VectorVest ProTrader 7
- VectorVest RealTime Derby Tool
- VectorVest Simulator
- VectorVest Variator
- VectorVest Watchdog
