HOT TOPICS LIST
- MACD
- Fibonacci
- RSI
- Gann
- ADXR
- Stochastics
- Volume
- Triangles
- Futures
- Cycles
- Volatility
- ZIGZAG
- MESA
- Retracement
- Aroon
INDICATORS LIST
LIST OF TOPICS
PRINT THIS ARTICLE
by Koos van der Merwe
You believe gold is going to the moon as the US dollar weakens. So what do you buy? Here is a cheapie to watch.
Position: Accumulate
Koos van der Merwe
Has been a technical analyst since 1969, and has worked as a futures and options trader with First Financial Futures in Johannesburg, South Africa.
PRINT THIS ARTICLE
DAY TRADING
Atna Resources Ltd.
10/09/07 12:43:58 PMby Koos van der Merwe
You believe gold is going to the moon as the US dollar weakens. So what do you buy? Here is a cheapie to watch.
Position: Accumulate
| Atna Resources Ltd. is building a successful gold exploration, development, and mining enterprise in Nevada. The company has a diverse portfolio of assets including an advanced gold project, which has the potential for near-term production and significant opportunity to increase the defined resource. In addition, the company owns a portfolio of exploration projects in Nevada, Canada, and Chile. Many of these projects are joint ventures with quality partners, spreading Atna's risk and leveraging its opportunities. |

|
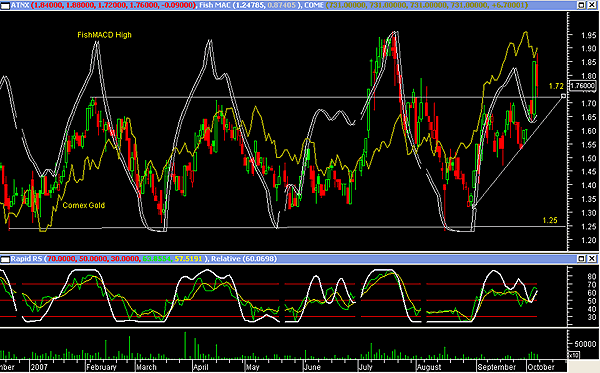
| FIGURE 1: ATN. Here's a stock to play the movement in the gold price. |
| Graphic provided by: MetaStock. |
| |
| After reading hype like this, you have to ask, "Is this a share I would like to own?" To answer this question, you look at your chart (Figure 1). The first thing that strikes you is the stock price, which in one year has moved from $0.98 to the present price of $1.76, a profit of 80% had you been clever enough to buy at the lower price. However, two things strike you about the chart. |
| a. The share price appears to anticipate the movement of the Comex gold price as you can see on the chart. b. The price is moving in a trading range from approximately $1.25 to $1.72. This means that the share could be more one to trade than one to hold for the long term. The chart does show the following indicators: a. FishMACDHigh. This is a Fisher transform formula of the moving average convergence/divergence (MACD) of the highs. The formula is available on request. This is the indicator I would use to daytrade the share. b. Rapid relative strength index (RSI) and a relative strength spread. The rapid RSI is used to verify the FishMACD buy and sell signals, by its overbought or oversold levels. c. The relative strength spread is another indicator I use to verify a FishMACD signal. The FishMACDHigh indicator, at the moment is suggesting a possible buy signal. But because the relative strength spread is moving down from an overbought level, I will not suggest taking the trade. The rapid RSI, not having reached overbought levels, is suggesting that I could be wrong in my decision, but I would rather wait to see a retest of the short-term trendline before buying. Finally, the gold price does appear to be weakening, which further influences my decision not to take the trade immediately. But the stock is on my watchlist, and should the indicators line up correctly, I shall place a bid. |
Has been a technical analyst since 1969, and has worked as a futures and options trader with First Financial Futures in Johannesburg, South Africa.
| Address: | 3256 West 24th Ave |
| Vancouver, BC | |
| Phone # for sales: | 6042634214 |
| E-mail address: | petroosp@gmail.com |
Click here for more information about our publications!
PRINT THIS ARTICLE

Request Information From Our Sponsors
- StockCharts.com, Inc.
- Candle Patterns
- Candlestick Charting Explained
- Intermarket Technical Analysis
- John Murphy on Chart Analysis
- John Murphy's Chart Pattern Recognition
- John Murphy's Market Message
- MurphyExplainsMarketAnalysis-Intermarket Analysis
- MurphyExplainsMarketAnalysis-Visual Analysis
- StockCharts.com
- Technical Analysis of the Financial Markets
- The Visual Investor
- VectorVest, Inc.
- Executive Premier Workshop
- One-Day Options Course
- OptionsPro
- Retirement Income Workshop
- Sure-Fire Trading Systems (VectorVest, Inc.)
- Trading as a Business Workshop
- VectorVest 7 EOD
- VectorVest 7 RealTime/IntraDay
- VectorVest AutoTester
- VectorVest Educational Services
- VectorVest OnLine
- VectorVest Options Analyzer
- VectorVest ProGraphics v6.0
- VectorVest ProTrader 7
- VectorVest RealTime Derby Tool
- VectorVest Simulator
- VectorVest Variator
- VectorVest Watchdog
