HOT TOPICS LIST
- MACD
- Fibonacci
- RSI
- Gann
- ADXR
- Stochastics
- Volume
- Triangles
- Futures
- Cycles
- Volatility
- ZIGZAG
- MESA
- Retracement
- Aroon
INDICATORS LIST
LIST OF TOPICS
PRINT THIS ARTICLE
by Chaitali Mohile
C&D Technologies Inc. has moved above long-term resistance with the supports of trendline and moving average.
Position: Buy
Chaitali Mohile
Active trader in the Indian stock markets since 2003 and a full-time writer. Trading is largely based upon technical analysis.
PRINT THIS ARTICLE
TECHNICAL ANALYSIS
C&D Technologies Looks For Breakout.
10/08/07 09:56:13 AMby Chaitali Mohile
C&D Technologies Inc. has moved above long-term resistance with the supports of trendline and moving average.
Position: Buy
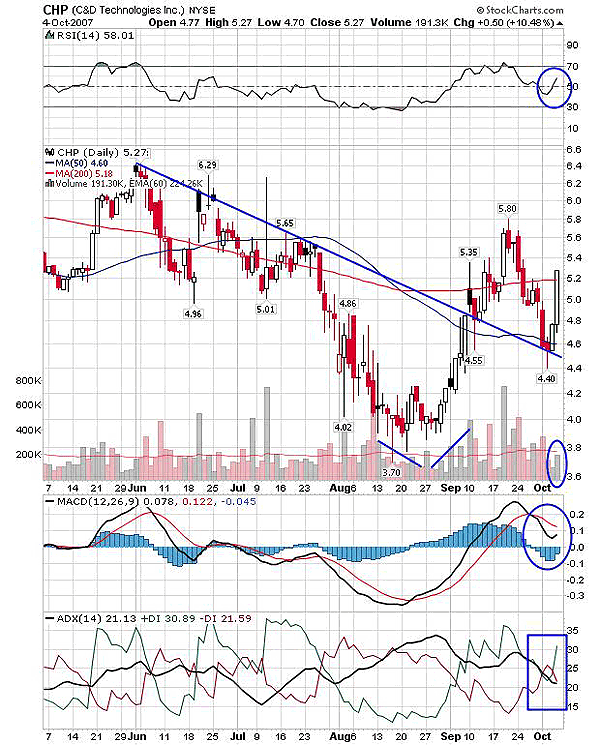
| C&D Technologies Inc. (CHP) has remained an underperforming stock over the past several years. After forming a double bottom at 3.80 on the long-term chart, some rebounding actions are seen on the short-term and medium-term charts. In Figure 1, CHP went through a highly volatile session within a support/resistance zone. The stock made lower highs here, followed by freefall bashing at the lower levels of 3.70. A rounding pattern is formed on the charts as buying came in. The two moving average resistances were gradually violated by the relief rally, making a high of 5.80. But being an underperforming stock, it seems traders are keen on profit booking at every high on a rally. |

|
| FIGURE 1: CHP, DAILY. The strong support of trendline as well as the 50-day moving average may help the stock continue the bullish rally. All three indicators are positive toward the rally. |
| Graphic provided by: StockCharts.com. |
| |
| The profit booking dragged the stock back to the 50-day moving average and under the pressure of the 200-day moving average. Apart from moving averages, the stock now has trendline support too. The trendline, joining the series of lower highs in the past, offers support to the recent downfall of the stock. With these supports, the stock is most likely to continue its bullish rally above the 200-day moving average resistance. The trendline support added strength to the breakout, and so, good buying may be in the future too. |
| The relative strength index (RSI)(14) at current levels is reconfirming the bullish strength and shows fresh buying opportunities. The average directional movement index (ADX)(14) is indicating a developing uptrend. And a vertically upward positive directional index (+DI) movement signals an increase in buying pressure as price continues its upside trip. The moving average convergence/divergence (MACD)(12,26,9) looks like it is ready for a bullish crossover, but you should wait for confirmation. Hence, the breakout above 5.2 or above the 200-day moving average can be bought on positive indications. |

|
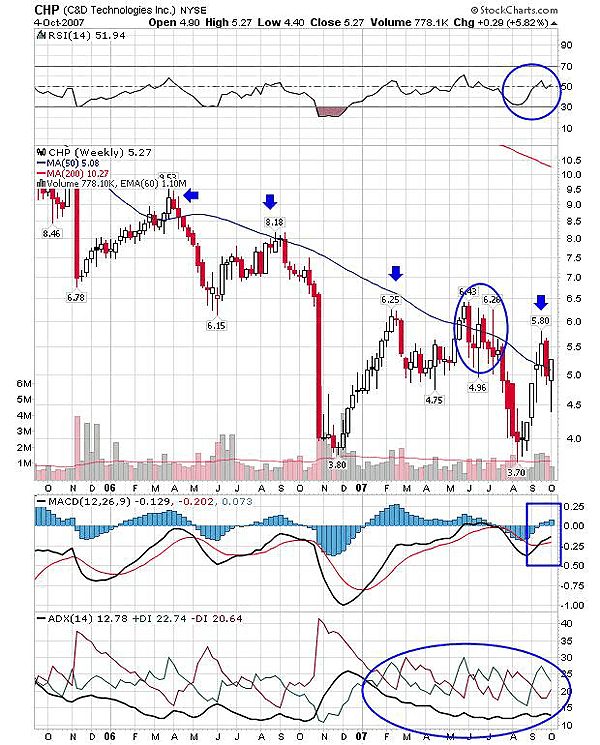
| FIGURE 2: CHP, WEEKLY. The 50-day moving average has plunged into the body of the present candle, and the stock has closed above the 50-day moving average. So the breakout is likely to sustain. |
| Graphic provided by: StockCharts.com. |
| |
| On the weekly chart in Figure 2, the 50-day moving average has kept the bullish rally miles away from the stock. The stock has plunged hard as resistance was hit. The 50-day moving average was retested more than three times since 2006-07. Only for a few weeks has CHP traded in the range of 5.0-6.5 under the support-resistance of the 50-day moving average. The stock tried to violate the historical resistance but failed and took a nosedive. The undergoing bullish rally can be seen consolidating (Figure 2) again in the same area but in a different price range. The 50-day moving average is now within the body of the present candle, which is a crucial level. The RSI (14) and MACD (12,26,9) are both positive toward the breakout and support the fresh long trades. But the ADX (14) on the weekly chart is more interesting. Since the beginning of 2007, the ADX (14) is not in favor of either trend and therefore such volatile sessions. The situation as of today hasn't changed. |
| I would recommend buying above the 200-day moving average with the minimum level of the previous high of 6.5 initially and book profits as the trade runs in profits. |
Active trader in the Indian stock markets since 2003 and a full-time writer. Trading is largely based upon technical analysis.
| Company: | Independent |
| Address: | C1/3 Parth Indraprasth Towers. Vastrapur |
| Ahmedabad, Guj 380015 | |
| E-mail address: | chaitalimohile@yahoo.co.in |
Traders' Resource Links | |
| Independent has not added any product or service information to TRADERS' RESOURCE. | |
Click here for more information about our publications!
PRINT THIS ARTICLE

Request Information From Our Sponsors
- StockCharts.com, Inc.
- Candle Patterns
- Candlestick Charting Explained
- Intermarket Technical Analysis
- John Murphy on Chart Analysis
- John Murphy's Chart Pattern Recognition
- John Murphy's Market Message
- MurphyExplainsMarketAnalysis-Intermarket Analysis
- MurphyExplainsMarketAnalysis-Visual Analysis
- StockCharts.com
- Technical Analysis of the Financial Markets
- The Visual Investor
- VectorVest, Inc.
- Executive Premier Workshop
- One-Day Options Course
- OptionsPro
- Retirement Income Workshop
- Sure-Fire Trading Systems (VectorVest, Inc.)
- Trading as a Business Workshop
- VectorVest 7 EOD
- VectorVest 7 RealTime/IntraDay
- VectorVest AutoTester
- VectorVest Educational Services
- VectorVest OnLine
- VectorVest Options Analyzer
- VectorVest ProGraphics v6.0
- VectorVest ProTrader 7
- VectorVest RealTime Derby Tool
- VectorVest Simulator
- VectorVest Variator
- VectorVest Watchdog
