HOT TOPICS LIST
- MACD
- Fibonacci
- RSI
- Gann
- ADXR
- Stochastics
- Volume
- Triangles
- Futures
- Cycles
- Volatility
- ZIGZAG
- MESA
- Retracement
- Aroon
INDICATORS LIST
LIST OF TOPICS
PRINT THIS ARTICLE
by David Penn
Positive divergences in both the MACD histogram and the stochastic anticipated a move higher in natural gas futures in October.
Position: N/A
David Penn
Technical Writer for Technical Analysis of STOCKS & COMMODITIES magazine, Working-Money.com, and Traders.com Advantage.
PRINT THIS ARTICLE
REVERSAL
Bounding Into Resistance: Positive Divergences Send December Natural Gas Higher
10/04/07 09:50:15 AMby David Penn
Positive divergences in both the MACD histogram and the stochastic anticipated a move higher in natural gas futures in October.
Position: N/A
| One of the most amazing collapses in the futures market in recent times took place in the market for natural gas futures in the second half of 2005. |
| Prices had been traveling in a wide range between, roughly, $7.50 and $5.00 throughout 2004 and through the first half of 2005. However, as prices moved higher in mid-August they managed to break out to new year-to-date highs north of $9.50 and kept on going. By the beginning of September, natural gas futures (basis continuous futures) cleared $10. By the end of the month, they passed above $14.00. After a short sharp pullback that saw the futures dip as low as $11 in mid-November, buyers were bidding prices higher once again, with natural gas reaching more than $15.75 by mid-December. |

|
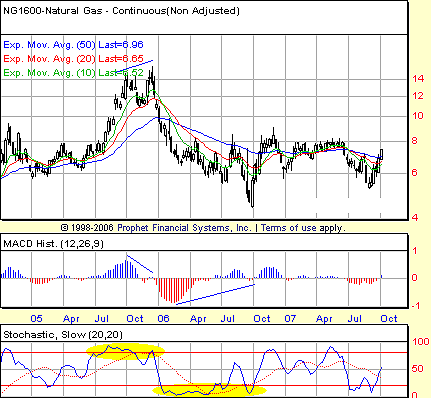
| FIGURE 1: NATURAL GAS, CONTINUOUS FUTURES, WEEKLY. Negative divergences anticipated the top in natural gas futures in 2005. Positive divergences in both the stochastic and the MACD histogram appear to have signaled a bottom in the first half of 2006. |
| Graphic provided by: Prophet Financial, Inc. |
| |
| Part of what is amazing about this spike in natural gas prices was the way the reversal was telegraphed. There may be no greater gift to the speculating community than a clear technical divergence at a top or bottom. And that gift was delivered right to the doorsteps of natural gas speculators everywhere December 30, when weekly negative divergences in both the stochastic and the MACD histogram were confirmed on the close. With a December 30th price of approximately $11.25 (basis continuous futures), natural gas was priced at a mere $6.65 only 10 sessions later. Since then, natural gas prices have returned to the (broadly speaking) $7.50–5.00 range that preceded the spike and collapse. In the summer of 2006, it appeared as if the collapse had come to an end. Prices had fallen to less than $4.60, but more important, a sizable positive divergence in both the stochastic and the MACD histogram developed, suggesting that the powerful downside momentum had finally ended. As I like to point out, there is a difference between momentum in one direction ending and momentum in the opposite direction beginning. So while the positive divergences were a bad thing for natural gas bears, those divergences weren't necessarily a "good" thing for natural gas bulls. |

|
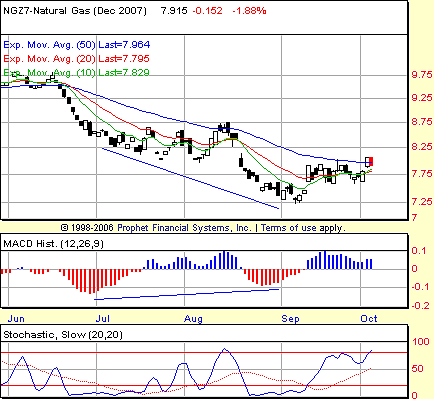
| FIGURE 2: NATURAL GAS, DECEMBER FUTURES, DAILY. Positive divergences in both the MACD histogram and the stochastic suggest higher prices ahead for natural gas. |
| Graphic provided by: Prophet Financial, Inc. |
| |
| Until, perhaps, now. Zooming in to look at the December contract for natural gas, we can see smaller, shorter-term positive divergences that could play a role in a sustained move higher. Specifically, these divergences relate to the "higher in price/lower in indicator" lows of late June and the "lower in price/higher in indicator" lows of late August and signaled a buying opportunity on August 28 that was not filled until September 12 at approximately $7.92. |
| One thing that is especially promising for natural gas bulls at this juncture is the presence of a sizable MACD histogram peak in September. This peak, coming just as prices were rallying from the bottom of the correction in late August/early September, is higher than any going back several months. As such, it is strongly suggestive of higher natural gas prices. |
Technical Writer for Technical Analysis of STOCKS & COMMODITIES magazine, Working-Money.com, and Traders.com Advantage.
| Title: | Technical Writer |
| Company: | Technical Analysis, Inc. |
| Address: | 4757 California Avenue SW |
| Seattle, WA 98116 | |
| Phone # for sales: | 206 938 0570 |
| Fax: | 206 938 1307 |
| Website: | www.Traders.com |
| E-mail address: | DPenn@traders.com |
Traders' Resource Links | |
| Charting the Stock Market: The Wyckoff Method -- Books | |
| Working-Money.com -- Online Trading Services | |
| Traders.com Advantage -- Online Trading Services | |
| Technical Analysis of Stocks & Commodities -- Publications and Newsletters | |
| Working Money, at Working-Money.com -- Publications and Newsletters | |
| Traders.com Advantage -- Publications and Newsletters | |
| Professional Traders Starter Kit -- Software | |
Click here for more information about our publications!
Comments

|

Request Information From Our Sponsors
- VectorVest, Inc.
- Executive Premier Workshop
- One-Day Options Course
- OptionsPro
- Retirement Income Workshop
- Sure-Fire Trading Systems (VectorVest, Inc.)
- Trading as a Business Workshop
- VectorVest 7 EOD
- VectorVest 7 RealTime/IntraDay
- VectorVest AutoTester
- VectorVest Educational Services
- VectorVest OnLine
- VectorVest Options Analyzer
- VectorVest ProGraphics v6.0
- VectorVest ProTrader 7
- VectorVest RealTime Derby Tool
- VectorVest Simulator
- VectorVest Variator
- VectorVest Watchdog
- StockCharts.com, Inc.
- Candle Patterns
- Candlestick Charting Explained
- Intermarket Technical Analysis
- John Murphy on Chart Analysis
- John Murphy's Chart Pattern Recognition
- John Murphy's Market Message
- MurphyExplainsMarketAnalysis-Intermarket Analysis
- MurphyExplainsMarketAnalysis-Visual Analysis
- StockCharts.com
- Technical Analysis of the Financial Markets
- The Visual Investor
