HOT TOPICS LIST
- MACD
- Fibonacci
- RSI
- Gann
- ADXR
- Stochastics
- Volume
- Triangles
- Futures
- Cycles
- Volatility
- ZIGZAG
- MESA
- Retracement
- Aroon
INDICATORS LIST
LIST OF TOPICS
PRINT THIS ARTICLE
by Chaitali Mohile
After forming a strong bottom, the security is set to move toward its old highs.
Position: Buy
Chaitali Mohile
Active trader in the Indian stock markets since 2003 and a full-time writer. Trading is largely based upon technical analysis.
PRINT THIS ARTICLE
BREAKOUTS
Lexmark Resumes Upward Track
10/04/07 11:36:23 AMby Chaitali Mohile
After forming a strong bottom, the security is set to move toward its old highs.
Position: Buy
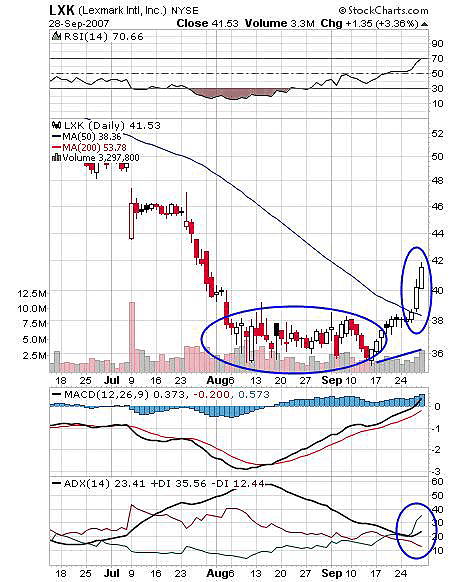
| Lexmark Inernational (LXK) has been in a strong downtrend for the past few years. The stock, which was worth $95 in 2004, hit a low of $40 by 2006, though it recovered somewhat up to $75 later that year. The stock was unable to sustain above the 50-day moving aveage support and within a month was on its way back down. In Figure 1, the 50-day moving average has sloped down steeply, and so has the price. There is a small gap down too. Since August 2007 and mid-September, the stock has moved sideways in range of 38-35, instead of moving down. That points toward the bottom formation after a slump. |
| The average directional movement index (ADX) (14) is above 20, indicating a developing uptrend. The positive directional index (+DI) has moved above the negative directional index (-DI) and also moved ahead of ADX. The relative strength index (RSI) (14) is in the overbought zone, reconfirming the bullish pressure to uphold the uptrend. More buyers' pressure is likely to come. The moving average convergence/divergence (MACD) (12,26,9) has been positive since August and is now moving in positive territory. Lexmark can be definitely bought at current levels with the target of previous highs. |

|
| FIGURE 1: LXK, DAILY. Lexmark has formed a strong bottom for the upside rally. The vertical move has turned the 50-day moving average resistance to support and the stock is now heading toward its old highs. |
| Graphic provided by: StockCharts.com. |
| |
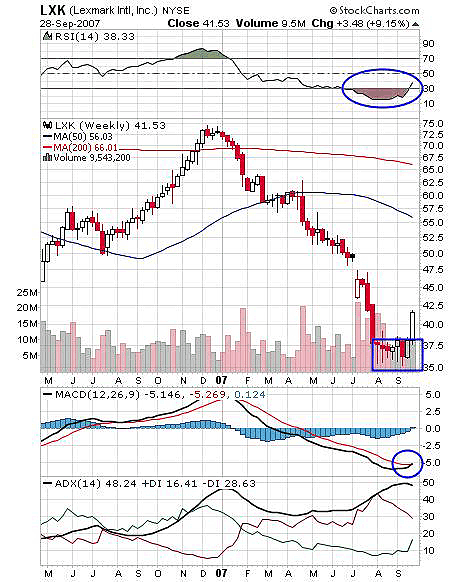
| On the weekly chart in Figure 2, the RSI (14) is offering a good buying opportunity with this rally. The indicator has recently moved out of the oversold zone and turning positive on long side trades. The ADX (14) had begun declining along with -DI. Though the uptrend is not indicated, the downtrend is likely to weaken further. The MACD (12,26,9) is ready for a bullish crossover, so the indicators are supporting the recent buying in Lexmark Int'l. In Figure 2, the security has just broken out of the consolidation range. Apart from the 50-day moving average resistance, the bull's path seems to be smooth enough to reach its target. |

|
| FIGURE 2: LXK, WEEKLY. The RSI (14) has moved out of its oversold area, opening fresh buying opportunities. The downtrend is about to weaken further with a declining ADX (14), therefore supporting an upward rally. |
| Graphic provided by: StockCharts.com. |
| |
| The bottom formation has accumulated fuel required for rocketing Lexmark to its previous highs. |
Active trader in the Indian stock markets since 2003 and a full-time writer. Trading is largely based upon technical analysis.
| Company: | Independent |
| Address: | C1/3 Parth Indraprasth Towers. Vastrapur |
| Ahmedabad, Guj 380015 | |
| E-mail address: | chaitalimohile@yahoo.co.in |
Traders' Resource Links | |
| Independent has not added any product or service information to TRADERS' RESOURCE. | |
Click here for more information about our publications!
PRINT THIS ARTICLE

Request Information From Our Sponsors
- VectorVest, Inc.
- Executive Premier Workshop
- One-Day Options Course
- OptionsPro
- Retirement Income Workshop
- Sure-Fire Trading Systems (VectorVest, Inc.)
- Trading as a Business Workshop
- VectorVest 7 EOD
- VectorVest 7 RealTime/IntraDay
- VectorVest AutoTester
- VectorVest Educational Services
- VectorVest OnLine
- VectorVest Options Analyzer
- VectorVest ProGraphics v6.0
- VectorVest ProTrader 7
- VectorVest RealTime Derby Tool
- VectorVest Simulator
- VectorVest Variator
- VectorVest Watchdog
- StockCharts.com, Inc.
- Candle Patterns
- Candlestick Charting Explained
- Intermarket Technical Analysis
- John Murphy on Chart Analysis
- John Murphy's Chart Pattern Recognition
- John Murphy's Market Message
- MurphyExplainsMarketAnalysis-Intermarket Analysis
- MurphyExplainsMarketAnalysis-Visual Analysis
- StockCharts.com
- Technical Analysis of the Financial Markets
- The Visual Investor
