HOT TOPICS LIST
- MACD
- Fibonacci
- RSI
- Gann
- ADXR
- Stochastics
- Volume
- Triangles
- Futures
- Cycles
- Volatility
- ZIGZAG
- MESA
- Retracement
- Aroon
INDICATORS LIST
LIST OF TOPICS
PRINT THIS ARTICLE
by Chaitali Mohile
XLP is heading toward new highs.
Position: Buy
Chaitali Mohile
Active trader in the Indian stock markets since 2003 and a full-time writer. Trading is largely based upon technical analysis.
PRINT THIS ARTICLE
CANDLESTICK CHARTING
Consumer Staples Select Sector Surges To Previous High
10/03/07 02:29:52 PMby Chaitali Mohile
XLP is heading toward new highs.
Position: Buy
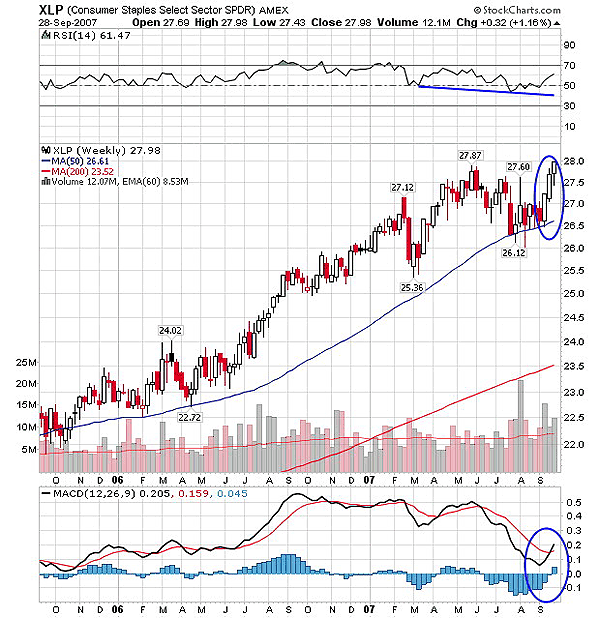
| The XLP has accumulated bullish strength at the 50-day moving average (MA) support. The consolidation range on this support broke as XLP rushed to 27-plus levels in the second week of September. The rally continued the next two weeks and reached the previous high resistance at 27.87. The three-week bullish move formed a three white soldiers candlestick pattern (see Figure 1). XLP declined from its previous highs initially and went through a long consolidation period. That was the period when the entire market was under bearish pressure. On the three white soldiers formation, the XLP went back to its previous highs. |
| The third candle closed marginally above the previous high pivot with a small lower shadow. The volume rose smartly, supporting the bullish move in the last three weeks. The moving average convergence/divergence (MACD)(12,26,9) is turning positive with a bullish crossover. The histogram has moved on zero-line support. The relative strength index (RSI)(14) has a lower low until the bullish run came up. The zig-zag moves to 50 levels, while the price consolidation failed to give any breakout indication, just accumulation. As the price surged above the upper range, the RSI (14) moved up. Now the indicator is healthy with a bullish bias. The strength shows new levels in XLP. |

|
| FIGURE 1: XLP, WEEKLY. The three white soldiers candlestick pattern made a high of $28. The pattern is well supported by a 50-day moving average and accompanied by increasing volume, so traders can take a good long-side trade on a confirmed breakout above $28. |
| Graphic provided by: StockCharts.com. |
| |
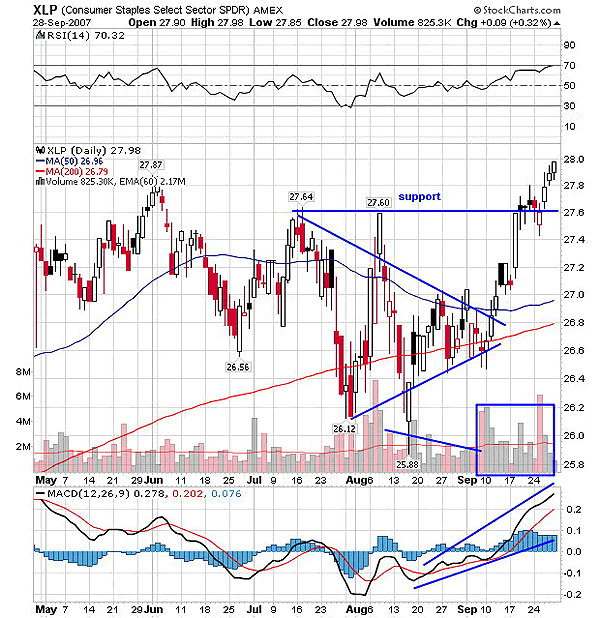
| As the global tumbling of the stock market came in, XLP sped up, forming lower highs, and the volatility that followed resulted in higher lows. The symmetrical triangle was formed, and eventually, XLP began moving in a narrower range. The breakout that happened in early September turned to a 50-day MA resistance to support and moved with strong new support. The current rally gradually made new highs, closing at 28. In Figure 2, the volume flow is pretty interesting. As volatility diminished on breakout, volume poured in. The RSI (14) and the MACD (12,26,9) are bullish, indicating higher levels in coming days. |

|
| FIGURE 2: XLP, DAILY. The triangular breakout led the rally above previous highs. This old high offered strong support to future bullish pressure. |
| Graphic provided by: StockCharts.com. |
| |
| Therefore, the three white soldiers are open to fresh buying in XLP. And the daily chart allows traders to go long on a confirmed breakout above $28, with a stop-loss of 27.64. |
Active trader in the Indian stock markets since 2003 and a full-time writer. Trading is largely based upon technical analysis.
| Company: | Independent |
| Address: | C1/3 Parth Indraprasth Towers. Vastrapur |
| Ahmedabad, Guj 380015 | |
| E-mail address: | chaitalimohile@yahoo.co.in |
Traders' Resource Links | |
| Independent has not added any product or service information to TRADERS' RESOURCE. | |
Click here for more information about our publications!
PRINT THIS ARTICLE

Request Information From Our Sponsors
- StockCharts.com, Inc.
- Candle Patterns
- Candlestick Charting Explained
- Intermarket Technical Analysis
- John Murphy on Chart Analysis
- John Murphy's Chart Pattern Recognition
- John Murphy's Market Message
- MurphyExplainsMarketAnalysis-Intermarket Analysis
- MurphyExplainsMarketAnalysis-Visual Analysis
- StockCharts.com
- Technical Analysis of the Financial Markets
- The Visual Investor
- VectorVest, Inc.
- Executive Premier Workshop
- One-Day Options Course
- OptionsPro
- Retirement Income Workshop
- Sure-Fire Trading Systems (VectorVest, Inc.)
- Trading as a Business Workshop
- VectorVest 7 EOD
- VectorVest 7 RealTime/IntraDay
- VectorVest AutoTester
- VectorVest Educational Services
- VectorVest OnLine
- VectorVest Options Analyzer
- VectorVest ProGraphics v6.0
- VectorVest ProTrader 7
- VectorVest RealTime Derby Tool
- VectorVest Simulator
- VectorVest Variator
- VectorVest Watchdog
