HOT TOPICS LIST
- MACD
- Fibonacci
- RSI
- Gann
- ADXR
- Stochastics
- Volume
- Triangles
- Futures
- Cycles
- Volatility
- ZIGZAG
- MESA
- Retracement
- Aroon
INDICATORS LIST
LIST OF TOPICS
PRINT THIS ARTICLE
by Paolo Pezzutti
The communications company plans a huge investment to implement a new technology to access the Internet.
Position: N/A
Paolo Pezzutti
Author of the book "Trading the US Markets - A Comprehensive Guide to US Markets for International Traders and Investors" - Harriman House (July 2008)
PRINT THIS ARTICLE
TECHNICAL ANALYSIS
Sprint: New Technology Not Paying Off So Far
10/02/07 09:57:59 AMby Paolo Pezzutti
The communications company plans a huge investment to implement a new technology to access the Internet.
Position: N/A
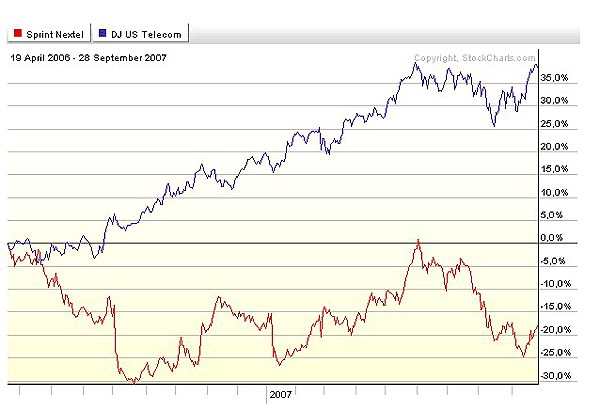
| Sprint Nextel Corp. (S) offers a range of wireless and wireline communications products and services, conducting its operations through the wireless and long-distance segments. The fundamentals are weak compared to many peers. The performance of the stock during the past years reflects this situation. In Figure 1 you can see a comparison of the performance between Sprint and the DJ US Telecommunications Index (DJUSTL) since April 2006. The difference is quite impressive. While the index is very close to its recent high as of last June and up 35%, Sprint is down almost 20%. The company is now trying to seek an edge over rivals and plans to spend up to $5 billion by 2010 to create a network with fast wireless connections to the Internet. This is part of a strategy to counter market leaders AT&T and Verizon Wireless, which are both growing significantly faster. The technology is called WiMax and is aimed at providing wireless data over long distances through point-to-point links or full mobile cellular type access. WiMAX is a means of increasing bandwidth for a variety of data-intensive applications. Although still not mature, the potential is great. |

|
| FIGURE 1: DJUSTI VS. S. The comparison between the performance of the DJ US Telecommunications Index and Sprint highlight the poor relative performance of the stock since April 2006. |
| Graphic provided by: StockCharts.com. |
| |
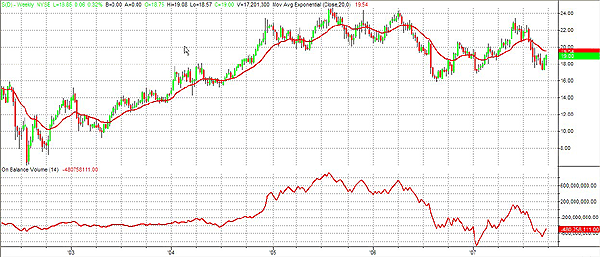
| For the moment, prices are not recognizing the possibility of Sprint succeeding in its bet. In Figure 2 you can see the weekly chart of the stock since 2003. Since the low of 2002 at $6.03 the stock has recovered up to the present $19, which is really not bad. However, you can also note that prices now are lower than in 2005, which in contrast have seen rapid advances in the Telecomm Index. Something is not working in the company's strategy to market its services. The on-balance volume displays a situation where accumulation of the stock is practically absent, whereas the Index has been constantly accumulated. You may recall that this indicator adds to a running total; the volume of each bar with a higher close than the bar before and subtracts from the total the volume of each bar with a lower close. The use of price and volume provides a different perspective from price or volume alone and divergences can also provide useful indications. |

|
| FIGURE 2: SPRINT, WEEKLY. The on-balance volume indicator shows that no accumulation has been on the stock during the past few years. |
| Graphic provided by: TradeStation. |
| |
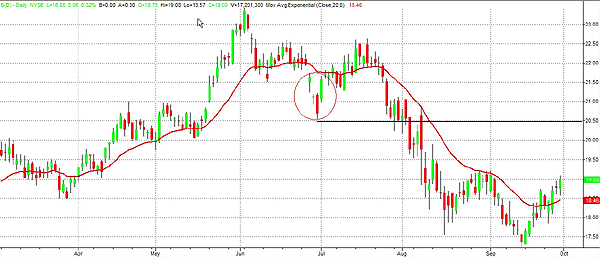
| On the daily chart in Figure 3, you can see how Sprint has developed a sharp correction from the top in June, which was above $23. Technically, the breakdown of the $20.50 level has been very negative as it negated a nice bullish pattern. |

|
| FIGURE 3: SPRINT, DAILY. The stock has developed a sharp down move since last June. The negation of the bullish pattern in the figure has been quite negative. |
| Graphic provided by: TradeStation. |
| |
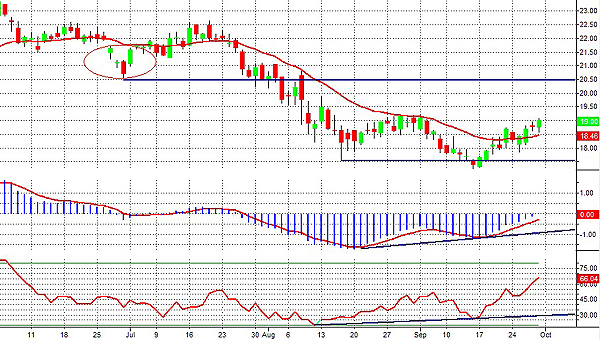
| In Figure 4, we see a shorter-term picture. Prices hit the previous low of $17.55 but did not break down below that level. Price re-entered the trading range and are now testing the previous relative high at $19.21, which represents an important resistance in the short term. What is interesting to note here is that both the moving average convergence/divergence (MACD) and the money flow indicators are printing a positive divergence. Should prices manage to break out above the resistance, the objective to the upside is identified in the $20.50 level that was so important at the beginning of the last downtrend. The money flow is based on the calculation of the average price, using the average of the open, close, high, and low of a bar. You have positive money flow when the current bar's average price exceeds the previous bar's average price. It is calculated by multiplying the current bar's volume and its average price. The use of this indicator through the analysis of positive and negative divergences is useful. Very simply, the MACD calculates two exponential moving averages (EMAs) of specified lengths and the difference is then plotted. This value is also averaged and then plotted. Also for this indicator, divergences can be helpful. |

|
| FIGURE 4: SPRINT, DAILY. The MACD and the money flow indicators are printing a positive divergence. Prices are now testing a short-term resistance. Next objective should the breakout be successful is at $20.50. |
| Graphic provided by: TradeStation. |
| |
| In summary, the technical situation of the stock in the short term indicates the possibility to continue the rebound toward the next resistance at $20.50. It is true, however, that at this point the risk/reward ratio is not particularly good. The situation in the medium term is not favorable to the stock that is clearly underperforming the peers index. Things could change in the future, should the market acknowledge that the technological choices of the company would provide great benefits to the balance sheets. For the moment, there is no sign of it from the technical side. |
Author of the book "Trading the US Markets - A Comprehensive Guide to US Markets for International Traders and Investors" - Harriman House (July 2008)
| Address: | VIA ROBERTO AGO 26 POSTAL CODE 00166 |
| Rome, ITALY | |
| Phone # for sales: | +393357540708 |
| E-mail address: | pezzutti.paolo@tiscali.it |
Click here for more information about our publications!
PRINT THIS ARTICLE

Request Information From Our Sponsors
- StockCharts.com, Inc.
- Candle Patterns
- Candlestick Charting Explained
- Intermarket Technical Analysis
- John Murphy on Chart Analysis
- John Murphy's Chart Pattern Recognition
- John Murphy's Market Message
- MurphyExplainsMarketAnalysis-Intermarket Analysis
- MurphyExplainsMarketAnalysis-Visual Analysis
- StockCharts.com
- Technical Analysis of the Financial Markets
- The Visual Investor
- VectorVest, Inc.
- Executive Premier Workshop
- One-Day Options Course
- OptionsPro
- Retirement Income Workshop
- Sure-Fire Trading Systems (VectorVest, Inc.)
- Trading as a Business Workshop
- VectorVest 7 EOD
- VectorVest 7 RealTime/IntraDay
- VectorVest AutoTester
- VectorVest Educational Services
- VectorVest OnLine
- VectorVest Options Analyzer
- VectorVest ProGraphics v6.0
- VectorVest ProTrader 7
- VectorVest RealTime Derby Tool
- VectorVest Simulator
- VectorVest Variator
- VectorVest Watchdog
