HOT TOPICS LIST
- MACD
- Fibonacci
- RSI
- Gann
- ADXR
- Stochastics
- Volume
- Triangles
- Futures
- Cycles
- Volatility
- ZIGZAG
- MESA
- Retracement
- Aroon
INDICATORS LIST
LIST OF TOPICS
PRINT THIS ARTICLE
by David Penn
A strong bull market in 2007 took December crude to levels not seen since August 2006. Is it time for crude to come in?
Position: N/A
David Penn
Technical Writer for Technical Analysis of STOCKS & COMMODITIES magazine, Working-Money.com, and Traders.com Advantage.
PRINT THIS ARTICLE
NEW HIGHS-NEW LOWS
December Crude Crosses The Line: New Highs And Negative Divergences
09/28/07 09:19:22 AMby David Penn
A strong bull market in 2007 took December crude to levels not seen since August 2006. Is it time for crude to come in?
Position: N/A
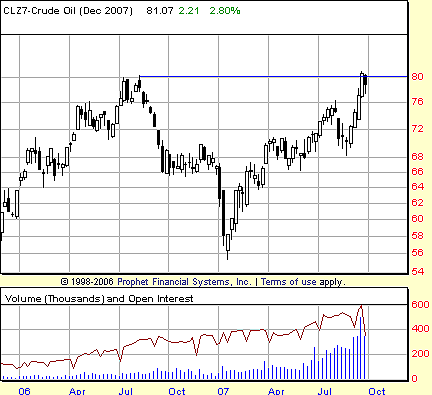
| There and back again. From the summer of 2006 to the first few weeks of 2007, December crude oil futures fell in a dizzying fashion. Topping out near $80 in 2006, December crude traded for as low as $56 a barrel at the beginning of 2007. As Figure 1 shows, however, that move down has been completely retraced as surges in crude oil prices in the first quarter of 2007, the summer of 2007, and the second half of the third quarter of 2007 lifted prices back above the $80 level. |

|
| FIGURE 1: CRUDE OIL, DECEMBER FUTURES, WEEKLY. The nine-month rally in December crude oil futures took the market to new highs in late September. But failure to follow through to the upside could mean that a significant correction is coming. |
| Graphic provided by: Prophet Financial, Inc. |
| |
| Oliver Velez Jr. once said, "Amateurs buy new highs, while pros sell them." As December crude soars toward particularly impressive new highs, Velez's point about selling those highs versus buying them comes into increased focus. My favorite technical way of confirming whether the "pros" are indeed selling new highs is the 2B test of top, which encourages traders to fade markets that make new highs but fail to follow through to the upside afterward. |
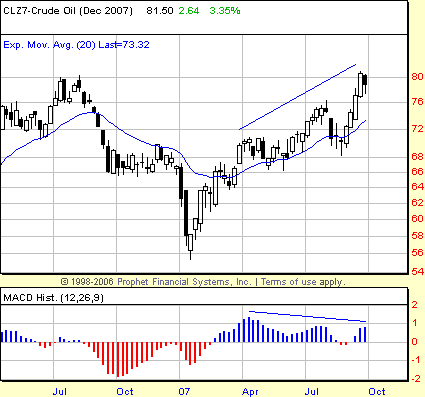
| So is December crude "fadeable" based on what we see in Figure 1? At this point, the answer is probably no, but traders should keep an eye on this market to see if it indeed will be able to move (and, important to note, close) at ever-higher prices. There is some evidence that the rally in December crude is waning. We can see this in the shape of the moving average convergence/divergence (MACD) histogram, which has been forming ever-smaller peaks since the summer of 2007. |

|
| FIGURE 2: CRUDE OIL, DECEMBER FUTURES, WEEKLY. Negative divergences are not uncommon in advancing trends. Traders looking to exploit corrections need to be ready to abandon their positions if the market shows signs of renewing the prevailing trend. |
| Graphic provided by: Prophet Financial, Inc. |
| |
| In order to trade negative divergences in the MACD histogram, traders need both an "mMm" pattern in the histogram as well as a confirming close below the low of the last "m" session. Looking at the initial negative divergence shown in Figure 2 — the divergence between the peaks early in the second quarter and early in the third — we can see the requisite mMm pattern in the second, smaller peak. This pattern, which takes place over the weeks from July 16 through the week beginning July 30, got a confirming close as of the end of the week beginning August 6. That confirming close would have a trader short at approximately 70.74. And while prices would have fallen as low as 68.30 before they bounced, there would have been some tense moments early in the trade as December crude eased higher before moving lower to that 68.30 intraweek low. |
| Traders looking to take even better advantage of a correction in December crude's rally will need a similar set up in the MACD histogram (the "mMm" pattern) before they can seriously begin thinking about shorting what has been a very strong move to the upside over the course of the past several months. But should that pattern appear and, it is important to note, the market make a confirming close below the low of the last "m" in the "mMm" pattern, then traders will have an opportunity to the short side that might be well worth making. |
Technical Writer for Technical Analysis of STOCKS & COMMODITIES magazine, Working-Money.com, and Traders.com Advantage.
| Title: | Technical Writer |
| Company: | Technical Analysis, Inc. |
| Address: | 4757 California Avenue SW |
| Seattle, WA 98116 | |
| Phone # for sales: | 206 938 0570 |
| Fax: | 206 938 1307 |
| Website: | www.Traders.com |
| E-mail address: | DPenn@traders.com |
Traders' Resource Links | |
| Charting the Stock Market: The Wyckoff Method -- Books | |
| Working-Money.com -- Online Trading Services | |
| Traders.com Advantage -- Online Trading Services | |
| Technical Analysis of Stocks & Commodities -- Publications and Newsletters | |
| Working Money, at Working-Money.com -- Publications and Newsletters | |
| Traders.com Advantage -- Publications and Newsletters | |
| Professional Traders Starter Kit -- Software | |
Click here for more information about our publications!
PRINT THIS ARTICLE

Request Information From Our Sponsors
- VectorVest, Inc.
- Executive Premier Workshop
- One-Day Options Course
- OptionsPro
- Retirement Income Workshop
- Sure-Fire Trading Systems (VectorVest, Inc.)
- Trading as a Business Workshop
- VectorVest 7 EOD
- VectorVest 7 RealTime/IntraDay
- VectorVest AutoTester
- VectorVest Educational Services
- VectorVest OnLine
- VectorVest Options Analyzer
- VectorVest ProGraphics v6.0
- VectorVest ProTrader 7
- VectorVest RealTime Derby Tool
- VectorVest Simulator
- VectorVest Variator
- VectorVest Watchdog
- StockCharts.com, Inc.
- Candle Patterns
- Candlestick Charting Explained
- Intermarket Technical Analysis
- John Murphy on Chart Analysis
- John Murphy's Chart Pattern Recognition
- John Murphy's Market Message
- MurphyExplainsMarketAnalysis-Intermarket Analysis
- MurphyExplainsMarketAnalysis-Visual Analysis
- StockCharts.com
- Technical Analysis of the Financial Markets
- The Visual Investor
