HOT TOPICS LIST
- MACD
- Fibonacci
- RSI
- Gann
- ADXR
- Stochastics
- Volume
- Triangles
- Futures
- Cycles
- Volatility
- ZIGZAG
- MESA
- Retracement
- Aroon
INDICATORS LIST
LIST OF TOPICS
PRINT THIS ARTICLE
by Gary Grosschadl
Over the last four months this alternative energy play has tested a bottom three times. Is this third time charmed?
Position: Buy
Gary Grosschadl
Independent Canadian equities trader and technical analyst based in Peterborough
Ontario, Canada.
PRINT THIS ARTICLE
REVERSAL
Ballard Power Systems Struggles With Bottom
09/28/07 09:09:00 AMby Gary Grosschadl
Over the last four months this alternative energy play has tested a bottom three times. Is this third time charmed?
Position: Buy
| Ballard Power Systems (BLD), which was originally founded as Ballard Research, is one of the larger companies developing fuel cell technology and has a hydrogen-powered bus running in Vancouver, British Columbia. |
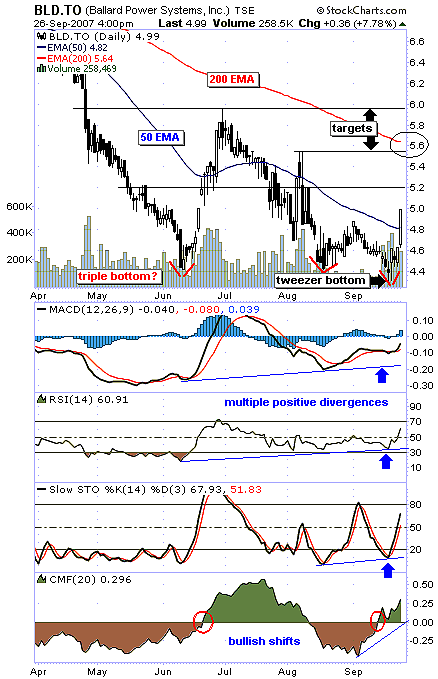
| This daily chart paints a rather painful picture of a stock trying to establish a bottom (Figure 1). Although the symmetry is not very good, we can discern that a possible triple bottom is in the making. Several indications lend some credence to this speculation. |

|
| FIGURE 1: BLD, DAILY. This chart hints at a thrust upward toward overhead resistance. |
| Graphic provided by: StockCharts.com. |
| |
| The latest bottom attempt shows a candlestick pattern called a "tweezer" bottom. The long matching tails give this tweezer appearance. This can signal a bottom. The subsequent trading action supports this via a large bullish candlestick closing above the nearby overhead resistance of the 50-day exponential moving average (EMA). In addition, the increased volume signal over the past week of trading shows bullish conviction. |
| Several displayed indicators under the chart show an important development via positive divergences. Multiple divergences are often a harbinger of a coming move. Note the slope of these indicators rising while the stock price has been dragging bottom. The moving average convergence/divergence (MACD), the relative strength index (RSI), and the stochastic oscillator all hint at a move off the bottom of the chart. Looking at the Chaikin money flow indicator (CMF), we see a shift to bullish buying power. The previous time this happened was last June, when the stock catapulted from $4.40 to near $6. |
| Should a tradable upthrust develop, an aggressive trader could target a zone between $5.55 and $6. This zone contains the overhead 200-day EMA, currently at 5.64, and previous resistance levels of 5.55 and near $6. For a better longer-term move to develop, we would have to see the stock find support from the always important 200-day EMA. Until that happens, speculative traders will most likely take the money and run in the surmised profit-taking zone of $5.60 to $6. |
Independent Canadian equities trader and technical analyst based in Peterborough
Ontario, Canada.
| Website: | www.whatsonsale.ca/financial.html |
| E-mail address: | gwg7@sympatico.ca |
Click here for more information about our publications!
PRINT THIS ARTICLE

Request Information From Our Sponsors
- StockCharts.com, Inc.
- Candle Patterns
- Candlestick Charting Explained
- Intermarket Technical Analysis
- John Murphy on Chart Analysis
- John Murphy's Chart Pattern Recognition
- John Murphy's Market Message
- MurphyExplainsMarketAnalysis-Intermarket Analysis
- MurphyExplainsMarketAnalysis-Visual Analysis
- StockCharts.com
- Technical Analysis of the Financial Markets
- The Visual Investor
- VectorVest, Inc.
- Executive Premier Workshop
- One-Day Options Course
- OptionsPro
- Retirement Income Workshop
- Sure-Fire Trading Systems (VectorVest, Inc.)
- Trading as a Business Workshop
- VectorVest 7 EOD
- VectorVest 7 RealTime/IntraDay
- VectorVest AutoTester
- VectorVest Educational Services
- VectorVest OnLine
- VectorVest Options Analyzer
- VectorVest ProGraphics v6.0
- VectorVest ProTrader 7
- VectorVest RealTime Derby Tool
- VectorVest Simulator
- VectorVest Variator
- VectorVest Watchdog
