HOT TOPICS LIST
- MACD
- Fibonacci
- RSI
- Gann
- ADXR
- Stochastics
- Volume
- Triangles
- Futures
- Cycles
- Volatility
- ZIGZAG
- MESA
- Retracement
- Aroon
INDICATORS LIST
LIST OF TOPICS
PRINT THIS ARTICLE
by Arthur Hill
Eli Lilly has been consolidating since early June and the coil is winding ever tighter ahead of an impending breakout.
Position: Hold
Arthur Hill
Arthur Hill is currently editor of TDTrader.com, a website specializing in trading strategies, sector/industry specific breadth stats and overall technical analysis. He passed the Society of Technical Analysts (STA London) diploma exam with distinction is a Certified Financial Technician (CFTe). Prior to TD Trader, he was the Chief Technical Analyst for Stockcharts.com and the main contributor to the ChartSchool.
PRINT THIS ARTICLE
SYMMETRICAL TRIANGLE
Lilly Winds Up For The Pitch
09/27/07 08:52:35 AMby Arthur Hill
Eli Lilly has been consolidating since early June and the coil is winding ever tighter ahead of an impending breakout.
Position: Hold
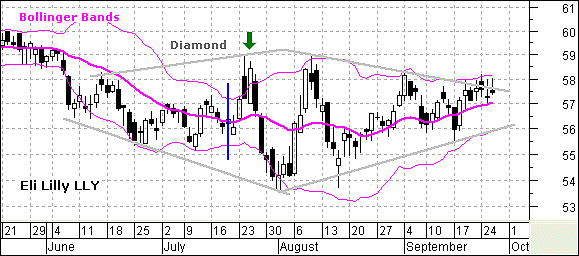
| Figure 1 shows Eli Lilly (LLY) with a diamond formation and the Bollinger Bands. The left half of the diamond shows a broadening formation and the right half shows a symmetrical triangle. The broadening formation was expanding but then started contracting to form the triangle. Taken together, this shows that LLY traded in a tight consolidation, expanded, and then moved back into a tight consolidation. Diamonds are neutral patterns that require a breakout for a directional bias. |

|
| FIGURE 1: LLY, DIAMOND AND BOLLINGER BANDS. The left half of the diamond shows a broadening formation and the right half shows a symmetrical triangle. |
| Graphic provided by: MetaStock. |
| |
| I have overlaid the Bollinger Bands and these are tightening again. Note that the bands tightened in early July just before volatility expanded (blue line). It looked like an upside breakout was occurring (green arrow), but the stock fell back sharply and then turned wild in the first half of August. Now that things have quieted down again, it is time to start looking for another volatility expansion. Bollinger Bands do not give us directional clues and we must turn to support/resistance for a breakout. |

|
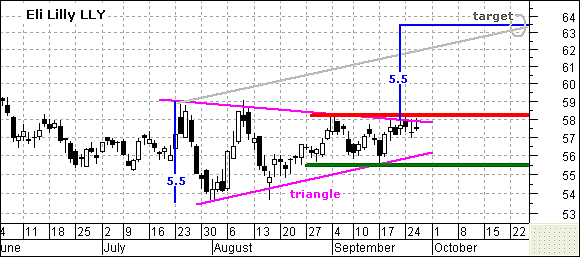
| FIGURE 2: LLY, SYMMETRICAL TRIANGLE. A break above resistance would be bullish and project further strength to around 63. |
| Graphic provided by: MetaStock. |
| |
| Figure 2 focuses on the symmetrical triangle with support at 55.5 and resistance at 58.2. A break above resistance would be bullish and project further strength to around 63–64. There were two ways to find this target. First, I drew a trendline parallel to the lower triangle trendline and extended it out. This gray trendline targets a move to around 63–64. Second, the length of the pattern (5.5) was added to the breakout. This also targets a move to around 63–64. I am only offering the bullish scenario here, but a break below 55.5 would clearly be bearish. Mirror techniques can be applied to estimate a downside target. |
Arthur Hill is currently editor of TDTrader.com, a website specializing in trading strategies, sector/industry specific breadth stats and overall technical analysis. He passed the Society of Technical Analysts (STA London) diploma exam with distinction is a Certified Financial Technician (CFTe). Prior to TD Trader, he was the Chief Technical Analyst for Stockcharts.com and the main contributor to the ChartSchool.
| Title: | Editor |
| Company: | TDTrader.com |
| Address: | Willem Geetsstraat 17 |
| Mechelen, B2800 | |
| Phone # for sales: | 3215345465 |
| Website: | www.tdtrader.com |
| E-mail address: | arthurh@tdtrader.com |
Traders' Resource Links | |
| TDTrader.com has not added any product or service information to TRADERS' RESOURCE. | |
Click here for more information about our publications!
PRINT THIS ARTICLE

|

Request Information From Our Sponsors
- StockCharts.com, Inc.
- Candle Patterns
- Candlestick Charting Explained
- Intermarket Technical Analysis
- John Murphy on Chart Analysis
- John Murphy's Chart Pattern Recognition
- John Murphy's Market Message
- MurphyExplainsMarketAnalysis-Intermarket Analysis
- MurphyExplainsMarketAnalysis-Visual Analysis
- StockCharts.com
- Technical Analysis of the Financial Markets
- The Visual Investor
- VectorVest, Inc.
- Executive Premier Workshop
- One-Day Options Course
- OptionsPro
- Retirement Income Workshop
- Sure-Fire Trading Systems (VectorVest, Inc.)
- Trading as a Business Workshop
- VectorVest 7 EOD
- VectorVest 7 RealTime/IntraDay
- VectorVest AutoTester
- VectorVest Educational Services
- VectorVest OnLine
- VectorVest Options Analyzer
- VectorVest ProGraphics v6.0
- VectorVest ProTrader 7
- VectorVest RealTime Derby Tool
- VectorVest Simulator
- VectorVest Variator
- VectorVest Watchdog
