HOT TOPICS LIST
- MACD
- Fibonacci
- RSI
- Gann
- ADXR
- Stochastics
- Volume
- Triangles
- Futures
- Cycles
- Volatility
- ZIGZAG
- MESA
- Retracement
- Aroon
INDICATORS LIST
LIST OF TOPICS
PRINT THIS ARTICLE
by Koos van der Merwe
Are you an inveterate, addictive explorer? Here is a stock you could explore with success.
Position: Accumulate
Koos van der Merwe
Has been a technical analyst since 1969, and has worked as a futures and options trader with First Financial Futures in Johannesburg, South Africa.
PRINT THIS ARTICLE
CUP WITH HANDLE
Pediment Exploration
09/27/07 09:32:58 AMby Koos van der Merwe
Are you an inveterate, addictive explorer? Here is a stock you could explore with success.
Position: Accumulate
| Pediment Exploration Ltd. is a mining exploration company with its head office located in Vancouver, Canada, and an exploration office located in Hermosillo, Mexico. Its mission is to acquire or discover gold, copper, and silver deposits that have been previously explored by "boot and hammer" prospecting. |

|
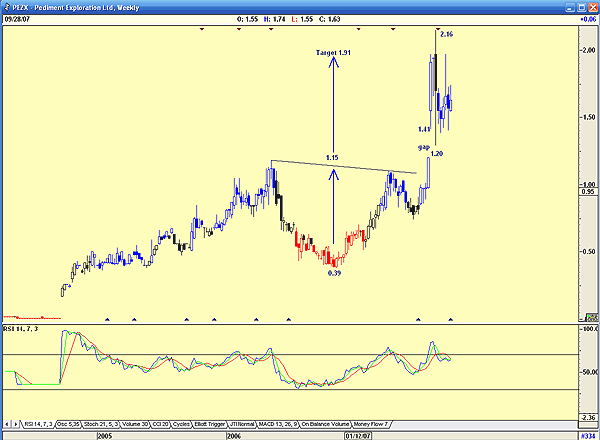
| FIGURE 1: PEDIMENT EXPLORATION, WEEKLY. Here, PEZ shows the cup with handle formation and the target. |
| Graphic provided by: AdvancedGET. |
| |
| Figure 1 is a weekly chart and shows how the stock price moved from a low of 38 cents to a high of $2.16 by August 2007. The chart shows a classic cup and handle formation, with a break above the handle on a gap. This suggested a target of $1.91 (1.15 - 0.39 = 0.76 + 1.15 = 1.91). The price reached a high of $2.16 before reversing. Note too that the relative strength index (RSI) is overbought and has given a sell signal, suggesting that the price could fall to fill the gap somewhere between $1.20 and $1.41. To fine-tune an entry level to purchase the share, I referred to a daily chart shown in Figure 2. |

|
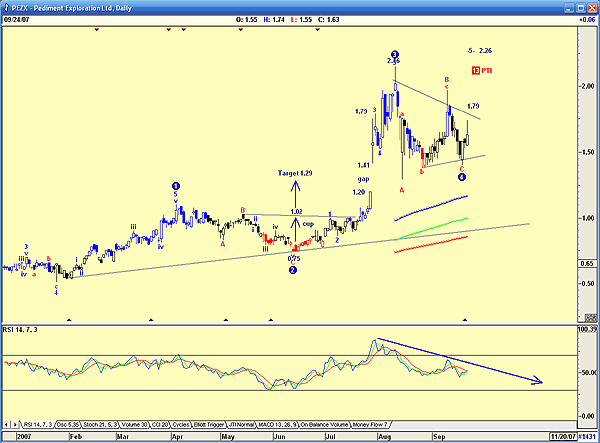
| FIGURE 2: PEDIMENT EXPLORATION, DAILY. Here's a suggested wave count and target. |
| Graphic provided by: AdvancedGET. |
| |
| Figure 2 shows a smaller more recent cup with a target of 1.29. As you can see, the price gapped up, breaking above this target and only correcting at the 1.79 price level, and then a small correction before rising to 2.16. From this high, it has fallen into what appears to be a consolidation triangle. This suggests a target of $2.79, should the price break out of the triangle (2.16 - 0.75 = 1.41 + 1.38 = 2.79). The Elliott wave count using Advanced GET suggests a fifth wave target of $2.26 with a 13 PTI. I have found that a PTI of less than 32 suggests that the wave count could be doubtful. The RSI's downtrend suggests that the price could retest the support line before rising to the target. Should this happen, it would turn the consolidation triangle into a flag, when the target would then change. |
| To conclude, this stock is now on my watchlist, but I will wait for the RSI to give me a definite buy signal or tell me should the price break above the resistance line of the triangle. Should this happen, I will reassess my strategy to the strength of the upward move. |
Has been a technical analyst since 1969, and has worked as a futures and options trader with First Financial Futures in Johannesburg, South Africa.
| Address: | 3256 West 24th Ave |
| Vancouver, BC | |
| Phone # for sales: | 6042634214 |
| E-mail address: | petroosp@gmail.com |
Click here for more information about our publications!
Comments

Request Information From Our Sponsors
- VectorVest, Inc.
- Executive Premier Workshop
- One-Day Options Course
- OptionsPro
- Retirement Income Workshop
- Sure-Fire Trading Systems (VectorVest, Inc.)
- Trading as a Business Workshop
- VectorVest 7 EOD
- VectorVest 7 RealTime/IntraDay
- VectorVest AutoTester
- VectorVest Educational Services
- VectorVest OnLine
- VectorVest Options Analyzer
- VectorVest ProGraphics v6.0
- VectorVest ProTrader 7
- VectorVest RealTime Derby Tool
- VectorVest Simulator
- VectorVest Variator
- VectorVest Watchdog
- StockCharts.com, Inc.
- Candle Patterns
- Candlestick Charting Explained
- Intermarket Technical Analysis
- John Murphy on Chart Analysis
- John Murphy's Chart Pattern Recognition
- John Murphy's Market Message
- MurphyExplainsMarketAnalysis-Intermarket Analysis
- MurphyExplainsMarketAnalysis-Visual Analysis
- StockCharts.com
- Technical Analysis of the Financial Markets
- The Visual Investor
