HOT TOPICS LIST
- MACD
- Fibonacci
- RSI
- Gann
- ADXR
- Stochastics
- Volume
- Triangles
- Futures
- Cycles
- Volatility
- ZIGZAG
- MESA
- Retracement
- Aroon
INDICATORS LIST
LIST OF TOPICS
PRINT THIS ARTICLE
by Chaitali Mohile
Genco Shipping & Trading Ltd. formed a strong bullish continuation pattern, but the breakout turned sideways.
Position: N/A
Chaitali Mohile
Active trader in the Indian stock markets since 2003 and a full-time writer. Trading is largely based upon technical analysis.
PRINT THIS ARTICLE
CUP WITH HANDLE
Breakout In GNK Fails
09/27/07 09:23:42 AMby Chaitali Mohile
Genco Shipping & Trading Ltd. formed a strong bullish continuation pattern, but the breakout turned sideways.
Position: N/A
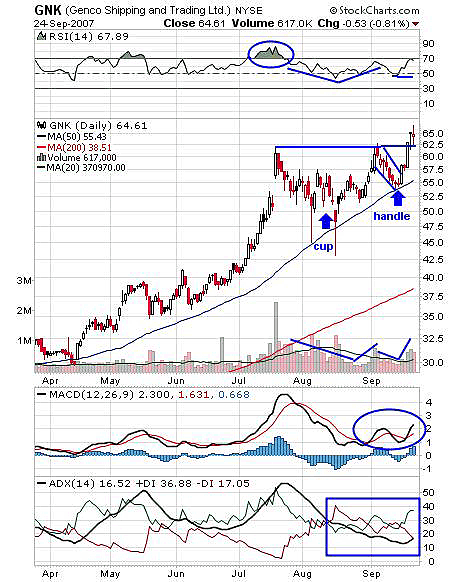
| In Figure 1 Genco Shipping & Trading Ltd. (GNK) has formed a cup with handle pattern. A cup with handle pattern is a reliable and strong continuation pattern that appears in an uptrend. This signifies the uptrend to continue after a breakout. GNK had an advance rally from 40 to 62 levels, and the cup formed is a reaction to this advance rally. With gap up, GNK made a high of 62 and corrected back around 12 points in a few weeks. As William O'Neil mentioned, GNK has formed a valid support around 50 before beginning the retest of the previous high. |
| The volume lowered as the trading range was developed near the bottom and increased with a pullback rally toward the previous high at 62. The "U" shaped cup formed and the volume satisfied the conditions specified by William O'Neil. Now, the handle is formed as the price dipped after a double top at 62. The traders can note that the handle in Figure 1 resembles flag & pennant sloping downward. The support established at the 50-day moving average (MA) helped to begin the bullish rally toward 62. The breakout on this pattern gives a strong upside rally above the prior high pivot accompanied with an increase in volume. |

|
| FIGURE 1: GNK, DAILY. The cup with handle breakout moved sideways instead of rocketing out. |
| Graphic provided by: StockCharts.com. |
| |
| The bullish rally with 50-day MA support, moved sharply to hit resistance at 62, and later as the breakout was on edge, the price turned sideways. This may have surprised traders as the breakout on the cup with handle reached new highs. GNK failed to give a successful breakout above 62. This may hold back the traders till the confirmed breakout happened. |
| The relative strength index (RSI) (14) was highly overbought at 62 levels. The decline also shows a cup with handle formation (see Figure 1). The bullish strength that came in with a 50 support level was reluctant to move. Therefore, the breakout turned sideways and the RSI (14) tipped down (still holding bullish force). The MACD (12,26,9) is positive, supporting a continuation pattern. The average directional movement index (ADX) (14) above 15 is indicating the consolidation phase instead of an upside rally. |
| Thus, the breakout of the cup with handle pattern has failed and is likely to remain sideways, according to the indicators. The breakout target can be estimated, measuring the height of the cup from the right peak to bottom. |
Active trader in the Indian stock markets since 2003 and a full-time writer. Trading is largely based upon technical analysis.
| Company: | Independent |
| Address: | C1/3 Parth Indraprasth Towers. Vastrapur |
| Ahmedabad, Guj 380015 | |
| E-mail address: | chaitalimohile@yahoo.co.in |
Traders' Resource Links | |
| Independent has not added any product or service information to TRADERS' RESOURCE. | |
Click here for more information about our publications!
PRINT THIS ARTICLE

Request Information From Our Sponsors
- StockCharts.com, Inc.
- Candle Patterns
- Candlestick Charting Explained
- Intermarket Technical Analysis
- John Murphy on Chart Analysis
- John Murphy's Chart Pattern Recognition
- John Murphy's Market Message
- MurphyExplainsMarketAnalysis-Intermarket Analysis
- MurphyExplainsMarketAnalysis-Visual Analysis
- StockCharts.com
- Technical Analysis of the Financial Markets
- The Visual Investor
- VectorVest, Inc.
- Executive Premier Workshop
- One-Day Options Course
- OptionsPro
- Retirement Income Workshop
- Sure-Fire Trading Systems (VectorVest, Inc.)
- Trading as a Business Workshop
- VectorVest 7 EOD
- VectorVest 7 RealTime/IntraDay
- VectorVest AutoTester
- VectorVest Educational Services
- VectorVest OnLine
- VectorVest Options Analyzer
- VectorVest ProGraphics v6.0
- VectorVest ProTrader 7
- VectorVest RealTime Derby Tool
- VectorVest Simulator
- VectorVest Variator
- VectorVest Watchdog
