HOT TOPICS LIST
- MACD
- Fibonacci
- RSI
- Gann
- ADXR
- Stochastics
- Volume
- Triangles
- Futures
- Cycles
- Volatility
- ZIGZAG
- MESA
- Retracement
- Aroon
INDICATORS LIST
LIST OF TOPICS
PRINT THIS ARTICLE
by Chaitali Mohile
The huge gap down has moved Biocrystal Pharmaceuticals below the support area, and weak breakout on the Health Care Select Sector Index may result in further downside.
Position: N/A
Chaitali Mohile
Active trader in the Indian stock markets since 2003 and a full-time writer. Trading is largely based upon technical analysis.
PRINT THIS ARTICLE
GAPS
BCRX Likely To See Further Downside
09/27/07 02:53:47 PMby Chaitali Mohile
The huge gap down has moved Biocrystal Pharmaceuticals below the support area, and weak breakout on the Health Care Select Sector Index may result in further downside.
Position: N/A
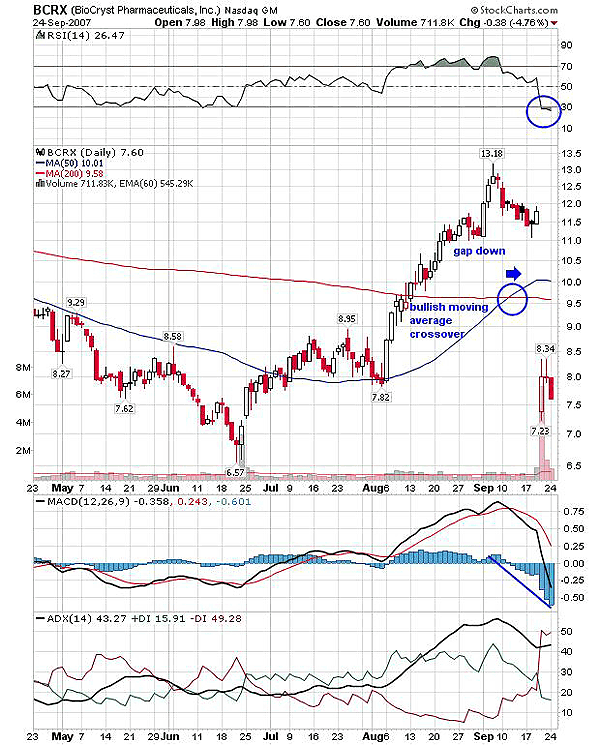
| Gaps occur either on some news out on a particular security or due to some sudden unpredictable changes. In Figure 1, Biocrystal Pharmaceuticals (BRCX) seemed technically strong with a bullish moving average crossover. However, some reaction of an overbought relative strength index (RSI)(14) was seen resulting in a marginal dip after the advance rally. The smart traders following this indicator may have moved out of their long positions as the RSI (14) began to decline. Therefore, a sudden gap down may not have harmed a large group of traders. |
| But gaps are highly unpredictable; BCRX opened with a huge gap down on September 20. The gap down moved below the strong support of the 200-day moving average (MA). Now let's look at the indicator's position after a gap down. The RSI (14) tumbled below 30, moving marginally in an oversold area. It still has downside space that can drag the price further below the existing level. The MACD (12,26,9) after a bearish crossover has moved into negative territory after the gap down. So this negative MACD (12,26,9) also brings bearish pressure on the security. |

|
| |
| Hence, there is a high possibility that the previous low pivot at 6.57 can be tested. I would avoid any short call here as a gap down has covered a wide trading area and a previous low is hardly a few steps away. So no trade is possible here. In addition, the average directional movement index (ADX)(14) is indicating an overheated downtrend at the 43 level. So we might see a range-bound move with 6.57 as the lower range. |
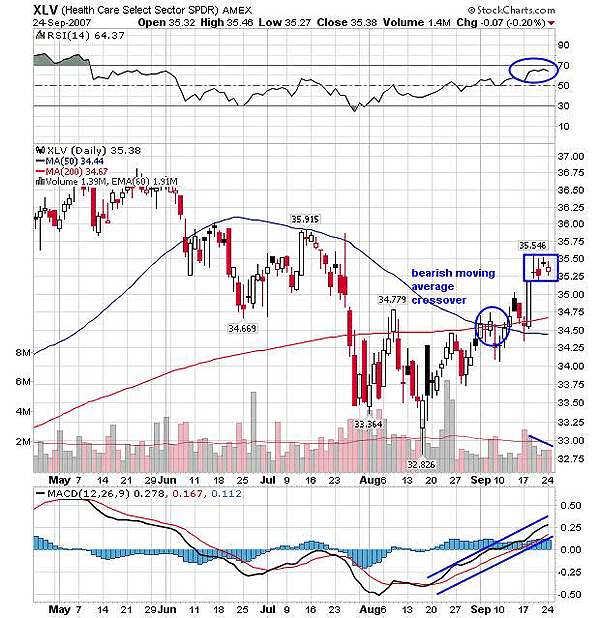
| Health Care Select Sector has a breakout on a bearish moving average crossover (Figure 2). This is an unfavorable condition for a healthy breakout. In addition, the volume diminished that made a breakout more suspicious for trading. As a result, a cluster of doji occurred after the breakout, indicating an uncertain directional move. This might bring in a narrower range of consolidation at 35.50-25 levels. The RSI (14) is still in an overbought area, indicating bullish strength. The MACD (12,26,9) is very positive, so both the indicators support the bullish force to uphold the consolidation after breakout. Neither indicator has a negative bias that can drag down the prices. |

|
| FIGURE 2: XLV, DAILY. Health Care Select Sector has a breakout on a bearish moving average crossover. |
| Graphic provided by: StockCharts.com. |
| |
| When some sector undergoes consolidation, the equities from same sector are likely to be affected accordingly. In this case, XLV has a weak breakout and entered in narrow consolidation, and BCRX comes under the same sector. Thus, this week's breakout in XLV may bring BCRX to a previous low and thereafter consolidate in a narrow range. |
Active trader in the Indian stock markets since 2003 and a full-time writer. Trading is largely based upon technical analysis.
| Company: | Independent |
| Address: | C1/3 Parth Indraprasth Towers. Vastrapur |
| Ahmedabad, Guj 380015 | |
| E-mail address: | chaitalimohile@yahoo.co.in |
Traders' Resource Links | |
| Independent has not added any product or service information to TRADERS' RESOURCE. | |
Click here for more information about our publications!
PRINT THIS ARTICLE

Request Information From Our Sponsors
- VectorVest, Inc.
- Executive Premier Workshop
- One-Day Options Course
- OptionsPro
- Retirement Income Workshop
- Sure-Fire Trading Systems (VectorVest, Inc.)
- Trading as a Business Workshop
- VectorVest 7 EOD
- VectorVest 7 RealTime/IntraDay
- VectorVest AutoTester
- VectorVest Educational Services
- VectorVest OnLine
- VectorVest Options Analyzer
- VectorVest ProGraphics v6.0
- VectorVest ProTrader 7
- VectorVest RealTime Derby Tool
- VectorVest Simulator
- VectorVest Variator
- VectorVest Watchdog
- StockCharts.com, Inc.
- Candle Patterns
- Candlestick Charting Explained
- Intermarket Technical Analysis
- John Murphy on Chart Analysis
- John Murphy's Chart Pattern Recognition
- John Murphy's Market Message
- MurphyExplainsMarketAnalysis-Intermarket Analysis
- MurphyExplainsMarketAnalysis-Visual Analysis
- StockCharts.com
- Technical Analysis of the Financial Markets
- The Visual Investor
