HOT TOPICS LIST
- MACD
- Fibonacci
- RSI
- Gann
- ADXR
- Stochastics
- Volume
- Triangles
- Futures
- Cycles
- Volatility
- ZIGZAG
- MESA
- Retracement
- Aroon
INDICATORS LIST
LIST OF TOPICS
PRINT THIS ARTICLE
by Chaitali Mohile
A rising wedge formation and a triple-top resistance in two different time frames may spoil the party in Cisco. Profit-booking may be wise at this stage.
Position: N/A
Chaitali Mohile
Active trader in the Indian stock markets since 2003 and a full-time writer. Trading is largely based upon technical analysis.
PRINT THIS ARTICLE
MONEY MANAGEMENT
Time To Book Profits In Cisco
09/27/07 10:35:13 AMby Chaitali Mohile
A rising wedge formation and a triple-top resistance in two different time frames may spoil the party in Cisco. Profit-booking may be wise at this stage.
Position: N/A
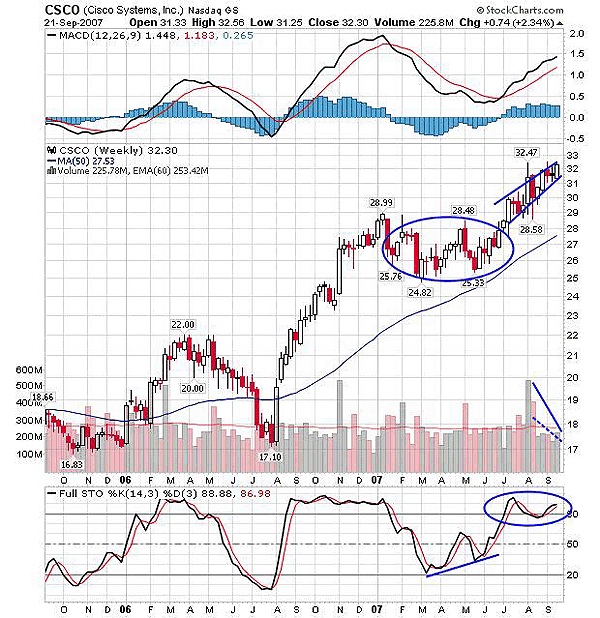
| Cisco (CSCO) entered a long consolidation phase in early 2007 after a fabulous advance rally from $17.10 to $28.99. The sideways consolidation was in the 24 to 28 range. The four-point range was highly volatile and was traded on higher volumes. The breakout happened around 28.50 equally on higher volume. The weekly chart shown in Figure 1 shows the breakout candle with a small leg. The volume also roared up with the breakout from the consolidation phase. But the volume and price movement went hand-in-hand only at the initial stage of rally; later on, the volume was exhausted with the price volatility. The rising wedge formed as price action continued in a smaller range accompanied by lower volume. |

|
| FIGURE 1: CISCO, WEEKLY. Cisco may take a temporary halt in an ongoing bullish rally with the effect of a rising wedge formation. |
| Graphic provided by: StockCharts.com. |
| |
| A rising wedge is a bearish formation indicating a temporary stop to a bullish rally. The moving average convergence/divergence (MACD) (12,26,9) is a positive indicating the bullish support even if some range-bound move comes in. The stochastic (14,3,3) is highly overbought at 88. This oscillator can move flat at an overbought, oversold position as well. So at the overbought level the stochastic may hold its bullish position by moving flat. In this scenario, I anticipate consolidation with a minor dip during the phase, and hence I recommend profit-booking at the current level. |
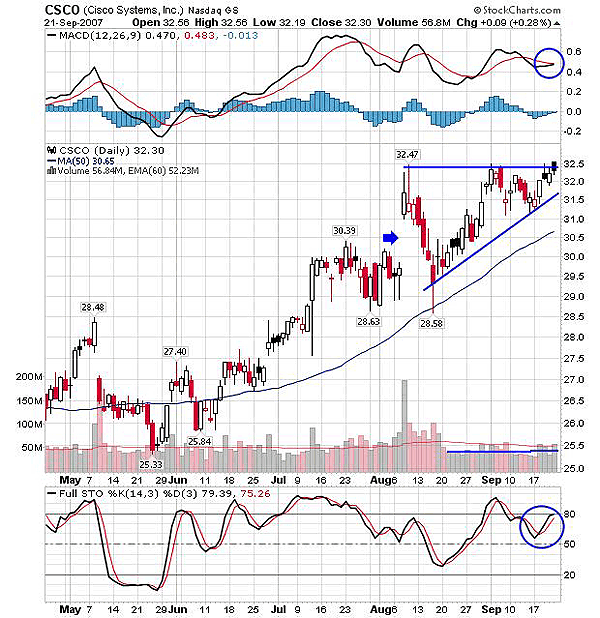
| In Figure 2 Cisco faced resistance at the 32.5 level three times. Earlier, the double-top formation retraced to the 31.5 level, forming a higher low in the rally. The third retest of resistance began with this support on comparatively good volume. But the next move seems critical, as the triple top is being formed now. If the stock gets a breakout here, then a fresh bullish rally will be born, but the triple-top effect is more likely to occur. When the triple top is formed, some decline in the rally can be expected. As a result, a previous low pivot can be tested. |

|
| FIGURE 2: CISCO, DAILY. The triple top may bring the price back to the previous low pivot. |
| Graphic provided by: StockCharts.com. |
| |
| Another view on Figure 2 is the gap up in the second week in August, which made a high of 32.47, and the stock made a low of 28.58 in the next few days. Thereafter, the series of resistance retests at 32.47 and higher lows began. This formed a triangular formation, which still has a small range left before an exact breakout. Therefore, a triangular breakout still has some way to go. This view supports the triple-top effect. So traders are requested to make note of it. The MACD (12,26,9) is likely to undergo a bullish crossover, which may bring bullish strength during the breakout. The stochastic (12,26,9) is overbought at 75 and is indicating the possibility of turning flat around. |
| Hence, the breakout on the daily chart (Figure 2) looks difficult on a technical basis and the weekly chart lacks any breakout indication (Figure 1). So traders should take profit or those who intend to hold on high risk should observe a strict stop-loss of 31.5. |
Active trader in the Indian stock markets since 2003 and a full-time writer. Trading is largely based upon technical analysis.
| Company: | Independent |
| Address: | C1/3 Parth Indraprasth Towers. Vastrapur |
| Ahmedabad, Guj 380015 | |
| E-mail address: | chaitalimohile@yahoo.co.in |
Traders' Resource Links | |
| Independent has not added any product or service information to TRADERS' RESOURCE. | |
Click here for more information about our publications!
PRINT THIS ARTICLE

Request Information From Our Sponsors
- StockCharts.com, Inc.
- Candle Patterns
- Candlestick Charting Explained
- Intermarket Technical Analysis
- John Murphy on Chart Analysis
- John Murphy's Chart Pattern Recognition
- John Murphy's Market Message
- MurphyExplainsMarketAnalysis-Intermarket Analysis
- MurphyExplainsMarketAnalysis-Visual Analysis
- StockCharts.com
- Technical Analysis of the Financial Markets
- The Visual Investor
- VectorVest, Inc.
- Executive Premier Workshop
- One-Day Options Course
- OptionsPro
- Retirement Income Workshop
- Sure-Fire Trading Systems (VectorVest, Inc.)
- Trading as a Business Workshop
- VectorVest 7 EOD
- VectorVest 7 RealTime/IntraDay
- VectorVest AutoTester
- VectorVest Educational Services
- VectorVest OnLine
- VectorVest Options Analyzer
- VectorVest ProGraphics v6.0
- VectorVest ProTrader 7
- VectorVest RealTime Derby Tool
- VectorVest Simulator
- VectorVest Variator
- VectorVest Watchdog
