HOT TOPICS LIST
- MACD
- Fibonacci
- RSI
- Gann
- ADXR
- Stochastics
- Volume
- Triangles
- Futures
- Cycles
- Volatility
- ZIGZAG
- MESA
- Retracement
- Aroon
INDICATORS LIST
LIST OF TOPICS
PRINT THIS ARTICLE
by Koos van der Merwe
The darkest scenario of the past few years for the world has been a falling US dollar. How much farther?
Position: N/A
Koos van der Merwe
Has been a technical analyst since 1969, and has worked as a futures and options trader with First Financial Futures in Johannesburg, South Africa.
PRINT THIS ARTICLE
ELLIOTT WAVE
The Falling US Dollar
09/26/07 05:58:24 PMby Koos van der Merwe
The darkest scenario of the past few years for the world has been a falling US dollar. How much farther?
Position: N/A
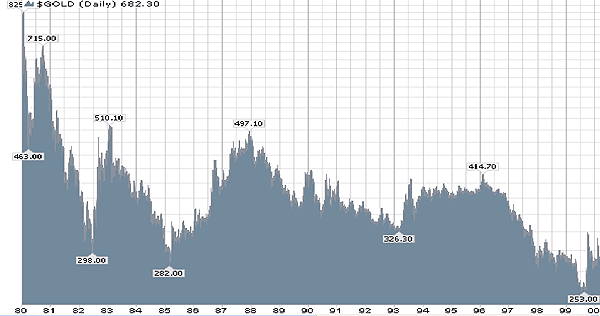
| When the United States decided to delink the US dollar from gold, the dollar became "as good as gold" for the rest of the world. It was far easier to buy and sell dollars on the market than to buy and sell physical bars of gold. The gold price started falling from a high of $825 in 1980 to $253 by the end of the century, as central banks around the world started selling their gold reserves. Figure 1, the chart here, taken from StockCharts shows the waves as gold fell. |

|
| FIGURE 1: GOLD, MONTHLY. Here are the waves as the price of gold fell. |
| Graphic provided by: StockCharts.com. |
| |
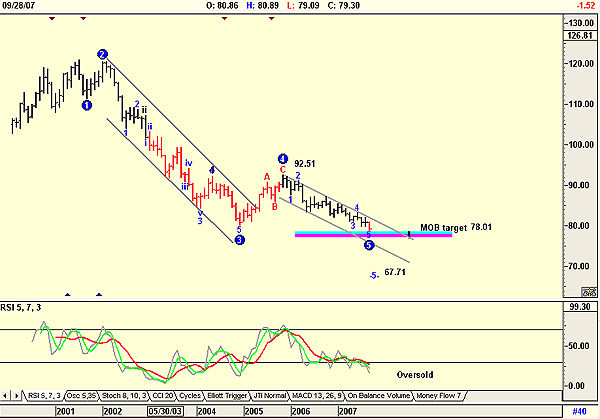
| My second chart shows how the US dollar has fallen since 2001 till today. My Elliott wave count suggests that the US dollar could be in the final throes of a fifth wave, with a possible target of 67.71. The MOB (make or break) indicator of Advanced GET suggests that the current target is indeed a little lower than present prices, but the MOB indicator also says that should the price not correct at its level, the price will fall the distance of the entry. This would see it fall to the 64 level, close to the fifth wave projection of 67. Note too that the relative strength index (RSI) is oversold. |

|
| FIGURE 2: US DOLLAR INDEX, MONHTLY. Here is how the US dollar has fallen from 2001 till today. |
| Graphic provided by: AdvancedGET. |
| |
| Investors appear to be spooked by the crises in the American financial markets, and they appear to be ditching dollars fast. Of course, a weak dollar suits the Federal Reserve, because the US borrowed money through the sale of Treasury bills at an expensive dollar and will now be repaying as the T-bills mature, with a cheap dollar. The thought was that a tumbling currency would prevent the Fed from cutting interest rates. The announcement shows how wrong they were, when the US cut rates not by the 25 basis points already discounted in the market, but by 50 basis points. Yes, the dollar has fallen further, but the decline has hardly been the anticipated panicked rout. It has fallen less than 1.5% since the financial turmoil started in early August. |
| How far can the dollar still fall? My charts are telling me that the bottom is close at hand. The US external deficit has shrunk considerably. Monthly trade figures for July showed exports growing at an annual rate of 14%, with imports at only 5%. This differential is the largest in years. With the recession that America is facing, a recession that I believe will be mild (see my previous article) imports will remain low, but will exports continue to grow? China, America's biggest supplier, has little to gain from a dollar crash, and may even be tempted to float the yuan. Then of course, the world could say, "To hell with the dollar, the euro is now as good as gold." My charts however, are suggesting otherwise. |
Has been a technical analyst since 1969, and has worked as a futures and options trader with First Financial Futures in Johannesburg, South Africa.
| Address: | 3256 West 24th Ave |
| Vancouver, BC | |
| Phone # for sales: | 6042634214 |
| E-mail address: | petroosp@gmail.com |
Click here for more information about our publications!
PRINT THIS ARTICLE

Request Information From Our Sponsors
- StockCharts.com, Inc.
- Candle Patterns
- Candlestick Charting Explained
- Intermarket Technical Analysis
- John Murphy on Chart Analysis
- John Murphy's Chart Pattern Recognition
- John Murphy's Market Message
- MurphyExplainsMarketAnalysis-Intermarket Analysis
- MurphyExplainsMarketAnalysis-Visual Analysis
- StockCharts.com
- Technical Analysis of the Financial Markets
- The Visual Investor
- VectorVest, Inc.
- Executive Premier Workshop
- One-Day Options Course
- OptionsPro
- Retirement Income Workshop
- Sure-Fire Trading Systems (VectorVest, Inc.)
- Trading as a Business Workshop
- VectorVest 7 EOD
- VectorVest 7 RealTime/IntraDay
- VectorVest AutoTester
- VectorVest Educational Services
- VectorVest OnLine
- VectorVest Options Analyzer
- VectorVest ProGraphics v6.0
- VectorVest ProTrader 7
- VectorVest RealTime Derby Tool
- VectorVest Simulator
- VectorVest Variator
- VectorVest Watchdog
