HOT TOPICS LIST
- MACD
- Fibonacci
- RSI
- Gann
- ADXR
- Stochastics
- Volume
- Triangles
- Futures
- Cycles
- Volatility
- ZIGZAG
- MESA
- Retracement
- Aroon
INDICATORS LIST
LIST OF TOPICS
PRINT THIS ARTICLE
by David Penn
Wouldn't you rather already be long when the market breaks out?
Position: N/A
David Penn
Technical Writer for Technical Analysis of STOCKS & COMMODITIES magazine, Working-Money.com, and Traders.com Advantage.
PRINT THIS ARTICLE
BREAKOUTS
Beat The Breakout: Histogram Patterns Anticipate The Move Higher In High-Grade Copper
09/26/07 10:12:26 AMby David Penn
Wouldn't you rather already be long when the market breaks out?
Position: N/A
| The breakout is the great dilemma of the momentum technical trader. Try and buy the market before the breakout and, like the watched pot that never boils, the breakout often never arrives. Try and buy the market after the breakout and watch your position melt away in the pullback that inevitably seems to follow immediately afterward. |
| Obviously the ideal preference would be to buy the market before the breakout and be present, front and center, to enjoy the ride higher as those late to the market drive prices higher. And no less obviously, buying before a market has actually shown the capacity to do what you as a trader think/hope/pray it will do is an inherently risky proposition. |

|
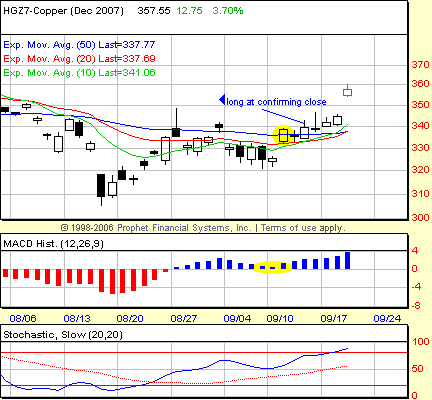
| FIGURE 1: COPPER, DECEMBER FUTURES, DAILY. The highlighted section of the middle panel shows the bullish MmM pattern in the MACD histogram. The highlighted candlestick in the main price chart shows the session that corresponds with the final “M” of the pattern. Trading this pattern meant buying the market as soon as it closed above the high of the session corresponding to the final “M” of the MmM pattern. |
| Graphic provided by: Prophet Financial, Inc. |
| |
| The solution, in a sense, is to find a reason to take a position before the breakout. Sure, in a sense I am assuming a breakout before it happens. But many times I've spotted buying opportunities within bases, bases that were building en route to often powerful breakouts. So if we have the implicit price support of a base-in-progress, then why not take the buy signal with the notion that if the market breaks out, we will already be long? |
| That sort of thinking would have kept copper traders in good stead in mid-September, as a consolidation range developed between late August and the first half of September between, roughly, 340 and 320 (Figure 1). The market for December copper had gone sideways, pinned beneath the 50-day exponential moving average (EMA). However, as of the close on September 11 two key things happened: the first was that HGZ7 closed above the 50-day EMA for the first time in more than a month. The second was that a bullish MmM pattern was completed in the moving average convergence/divergence (MACD) histogram. |
| I've written a great deal about the MACD histogram and the various bullish and bearish patterns that it creates. What is key is to note whether the market is able to show follow-through on a closing basis after the pattern is complete. In this case, that meant a close above the high of the session when the MmM pattern was completed — in other words, a high above the high on September 11. That close — what I call a "confirming close" — occurred just two days after the MmM pattern was completed, with a close of 339.65 (or $3.3965 per pound). Three days later, December copper was closing at 344.80 ($3.4480 per pound). That five-odd cent gain was worth more than $1200 per contract. The day after that, HGZ7 broke out to the upside, closing at 357.55 ($3.5755 per pound) for a gain of approximately $4,475 per contract in less than five days. |
Technical Writer for Technical Analysis of STOCKS & COMMODITIES magazine, Working-Money.com, and Traders.com Advantage.
| Title: | Technical Writer |
| Company: | Technical Analysis, Inc. |
| Address: | 4757 California Avenue SW |
| Seattle, WA 98116 | |
| Phone # for sales: | 206 938 0570 |
| Fax: | 206 938 1307 |
| Website: | www.Traders.com |
| E-mail address: | DPenn@traders.com |
Traders' Resource Links | |
| Charting the Stock Market: The Wyckoff Method -- Books | |
| Working-Money.com -- Online Trading Services | |
| Traders.com Advantage -- Online Trading Services | |
| Technical Analysis of Stocks & Commodities -- Publications and Newsletters | |
| Working Money, at Working-Money.com -- Publications and Newsletters | |
| Traders.com Advantage -- Publications and Newsletters | |
| Professional Traders Starter Kit -- Software | |
Click here for more information about our publications!
PRINT THIS ARTICLE

Request Information From Our Sponsors
- StockCharts.com, Inc.
- Candle Patterns
- Candlestick Charting Explained
- Intermarket Technical Analysis
- John Murphy on Chart Analysis
- John Murphy's Chart Pattern Recognition
- John Murphy's Market Message
- MurphyExplainsMarketAnalysis-Intermarket Analysis
- MurphyExplainsMarketAnalysis-Visual Analysis
- StockCharts.com
- Technical Analysis of the Financial Markets
- The Visual Investor
- VectorVest, Inc.
- Executive Premier Workshop
- One-Day Options Course
- OptionsPro
- Retirement Income Workshop
- Sure-Fire Trading Systems (VectorVest, Inc.)
- Trading as a Business Workshop
- VectorVest 7 EOD
- VectorVest 7 RealTime/IntraDay
- VectorVest AutoTester
- VectorVest Educational Services
- VectorVest OnLine
- VectorVest Options Analyzer
- VectorVest ProGraphics v6.0
- VectorVest ProTrader 7
- VectorVest RealTime Derby Tool
- VectorVest Simulator
- VectorVest Variator
- VectorVest Watchdog
