HOT TOPICS LIST
- MACD
- Fibonacci
- RSI
- Gann
- ADXR
- Stochastics
- Volume
- Triangles
- Futures
- Cycles
- Volatility
- ZIGZAG
- MESA
- Retracement
- Aroon
INDICATORS LIST
LIST OF TOPICS
PRINT THIS ARTICLE
by Chaitali Mohile
The long consolidation phase ends up with an encouraging breakout in the S&P Chemical Index.
Position: Buy
Chaitali Mohile
Active trader in the Indian stock markets since 2003 and a full-time writer. Trading is largely based upon technical analysis.
PRINT THIS ARTICLE
BREAKOUTS
S&P Chemical Index Breakout
09/27/07 06:23:00 AMby Chaitali Mohile
The long consolidation phase ends up with an encouraging breakout in the S&P Chemical Index.
Position: Buy
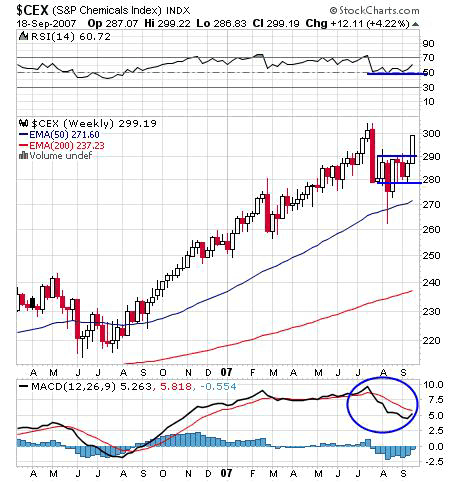
| The S&P Chemical Index went through a long correction of 20 points, making a low of 280 from its all-time high above the 300 level. The index entered a volatile consolidation period after the dip. Here the consolidation range was narrow, making trading very difficult. Such range-bound moves should be avoided as it is difficult to judge the exact direction of price movement. The confirmation breakout can be a good opportunity to enter the stock or index. |
| Consolidation is necessary at every stage after an advancing or declining move. The stock accumulates strength while consolidating and the range can vary too. Here, the range was 10 points, which made trading within the range very risky. If the congestion range is large, then it can be traded with if volume is less than average. In Figure 1, the chemical index was consolidating for almost five to six weeks. With the Fed news out on September 18, the chemical index explored along with other indexes. This breakout can move ahead of the previous high and is also likely to make new highs. |

|
| FIGURE 1: $CEX, WEEKLY. S&P Chemical Index moved out of small-range consolidation. The index is likely to make a new high with this breakout. |
| Graphic provided by: StockCharts.com. |
| |
| The relative strength index (RSI)(14), after the vertical downside established support at the 50 level, indicated the possibility of bullish strength. In addition, during consolidation the indicator sustained its support. This enhanced the possibility of a bullish ride. The moving average convergence/divergence (MACD)(12,26,9) went through a bearish crossover in positive territory during the correction. With the recent breakout of consolidation, the indicator is ready to cross over its trigger line from below, giving a bullish crossover. With a confirmed bullish crossover and an overbought RSI (14) at the 60 level, traders can surely get into the long positions on this index. |
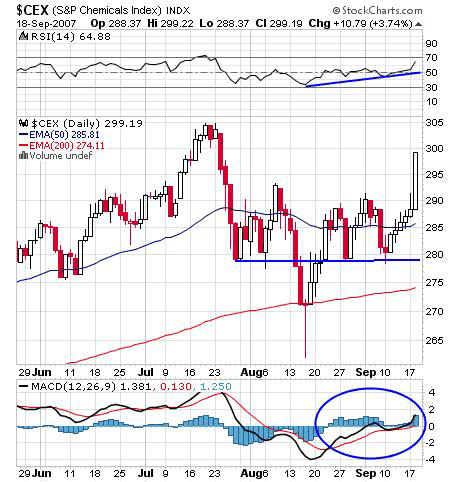
| In the daily chart shown in Figure 2, the index moved below the 50-day moving average till it hit 280. Prices then moved back up to 290 establishing a resistance level there. Prices failed to violate these resistance levels, whereas the lower range was crossed, but retraced at the 200-day EMA support. But the price rushed back to establish support again on the lower range. Finally, the rally that began on September 11 successfully moved above the 50-day MA resistance, and also above the upper range of consolidation. |

|
| FIGURE 2: $CEX, DAILY. The 50-day EMA resistance and upper range of consolidation is taken off. The positive indicators are likely to boost up the breakout. |
| Graphic provided by: StockCharts.com. |
| |
| The RSI (14) made a higher low, reconfirming a bullish rally to come. The bullish strength is indicated by the RSI (14) as it moved above 50. The MACD (12,26,9) is trying to move into positive territory. The higher high of MACD (12,26,9) also signaled the bullish strength. Thus, the breakout on the S&P Chemical Index can be bought. |
Active trader in the Indian stock markets since 2003 and a full-time writer. Trading is largely based upon technical analysis.
| Company: | Independent |
| Address: | C1/3 Parth Indraprasth Towers. Vastrapur |
| Ahmedabad, Guj 380015 | |
| E-mail address: | chaitalimohile@yahoo.co.in |
Traders' Resource Links | |
| Independent has not added any product or service information to TRADERS' RESOURCE. | |
Click here for more information about our publications!
PRINT THIS ARTICLE

Request Information From Our Sponsors
- VectorVest, Inc.
- Executive Premier Workshop
- One-Day Options Course
- OptionsPro
- Retirement Income Workshop
- Sure-Fire Trading Systems (VectorVest, Inc.)
- Trading as a Business Workshop
- VectorVest 7 EOD
- VectorVest 7 RealTime/IntraDay
- VectorVest AutoTester
- VectorVest Educational Services
- VectorVest OnLine
- VectorVest Options Analyzer
- VectorVest ProGraphics v6.0
- VectorVest ProTrader 7
- VectorVest RealTime Derby Tool
- VectorVest Simulator
- VectorVest Variator
- VectorVest Watchdog
- StockCharts.com, Inc.
- Candle Patterns
- Candlestick Charting Explained
- Intermarket Technical Analysis
- John Murphy on Chart Analysis
- John Murphy's Chart Pattern Recognition
- John Murphy's Market Message
- MurphyExplainsMarketAnalysis-Intermarket Analysis
- MurphyExplainsMarketAnalysis-Visual Analysis
- StockCharts.com
- Technical Analysis of the Financial Markets
- The Visual Investor
