HOT TOPICS LIST
- MACD
- Fibonacci
- RSI
- Gann
- ADXR
- Stochastics
- Volume
- Triangles
- Futures
- Cycles
- Volatility
- ZIGZAG
- MESA
- Retracement
- Aroon
INDICATORS LIST
LIST OF TOPICS
PRINT THIS ARTICLE
by Chaitali Mohile
ALU slipped faster with three gaps down. The return journey could begin soon, according to oscillators.
Position: N/A
Chaitali Mohile
Active trader in the Indian stock markets since 2003 and a full-time writer. Trading is largely based upon technical analysis.
PRINT THIS ARTICLE
GAPS
Alcatel-Lucent Has Vertical Fall
09/26/07 06:17:16 PMby Chaitali Mohile
ALU slipped faster with three gaps down. The return journey could begin soon, according to oscillators.
Position: N/A
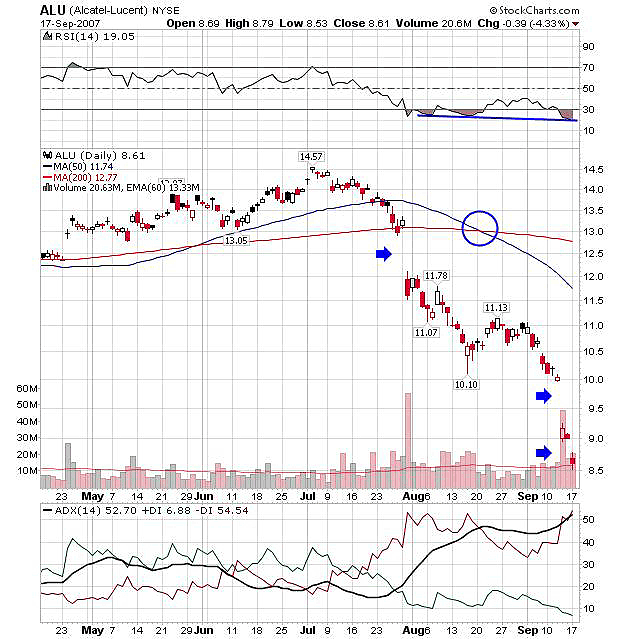
| The technical chart of Alcatel-Lucent (ALU) shows weak performance against strong fundamentals. In Figure 1, ALU has three downside gaps, losing strong supports as its decline continued. A dollar gap down at the end of July left behind the 200-day moving average support. Thereafter, the dip became more serious and moved to $10.11. With a minor range-bound move, after the decline, the stock attempted another two consecutive gaps down. During the entire fall, the stock lost around $6 on low volume. |

|
| FIGURE 1: ALU, DAILY. The downfall looks very limited with oversold RSI (14) and highly overheated ADX (14). |
| Graphic provided by: StockCharts.com. |
| |
| Gaps usually get filled sooner or later, but here, no mark of recovery could be seen during the correction. In addition, the bearish moving average crossover resulted in further weakness. The relative strength index (RSI)(14) moved deeper than the previous oversold position. The RSI(14) indicates a struggle between the bears and bulls before forming a second dip. The daily chart seen in Figure 1 shows that the indicator is highly oversold with limited downside. The average directional movement index (ADX)(14) is highly overheated at the 52 level. This implies the downtrend has reached its peak. Above 40, the ADX (14) is considered overheated and can reach the 60-65 levels. But as the overheated level increases, the trend is likely to lose its steam or enter a consolidation phase. In this chart, the ADX (14) indicates a slowdown in the downtrend. |
| This stock may start its pullback rally some time soon. There is no space left for the downside to continue. The worst possibility is it may consolidate before the upside rally begins, but the bullish rally is clearly visible, according to indicators. The gaps formed can get filled during this pullback rally under the resistance of moving averages. |

|
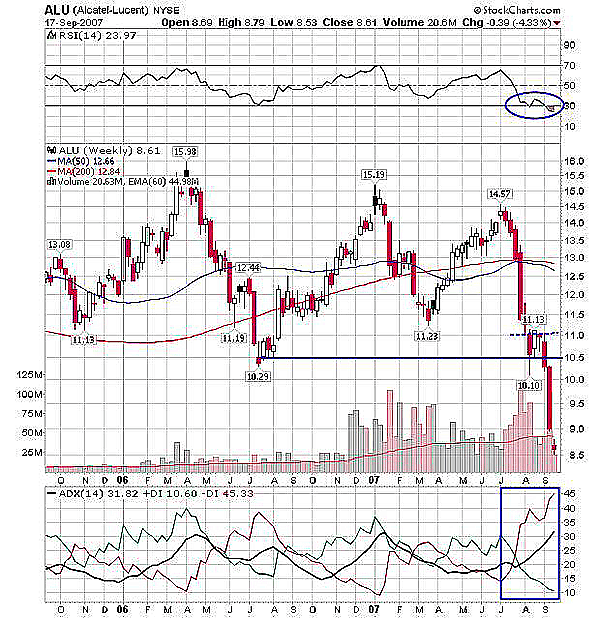
| FIGURE 2: ALU, WEEKLY. A bearish flag & pennant made a low of 8.5. Indicators suggest the possibility of marginal consolidation before resuming an upward rally. |
| Graphic provided by: StockCharts.com. |
| |
| The weekly chart in Figure 2 shows a bearish flag & pennant breakdown at approximate 10.5 levels. After the decline from 14.57 to 11.13, the stock entered the support-resistance area of previous low pivots, therefore entering a consolidation. On the breakdown, the stock lost another dollar, reaching a level of 8.5. The RSI (14) in Figure 2 made a new low with the dip in price and turned oversold. The ADX (14) is also overheated so that points to the possibility of consolidation before the upside rally. |
Active trader in the Indian stock markets since 2003 and a full-time writer. Trading is largely based upon technical analysis.
| Company: | Independent |
| Address: | C1/3 Parth Indraprasth Towers. Vastrapur |
| Ahmedabad, Guj 380015 | |
| E-mail address: | chaitalimohile@yahoo.co.in |
Traders' Resource Links | |
| Independent has not added any product or service information to TRADERS' RESOURCE. | |
Click here for more information about our publications!
PRINT THIS ARTICLE

Request Information From Our Sponsors
- StockCharts.com, Inc.
- Candle Patterns
- Candlestick Charting Explained
- Intermarket Technical Analysis
- John Murphy on Chart Analysis
- John Murphy's Chart Pattern Recognition
- John Murphy's Market Message
- MurphyExplainsMarketAnalysis-Intermarket Analysis
- MurphyExplainsMarketAnalysis-Visual Analysis
- StockCharts.com
- Technical Analysis of the Financial Markets
- The Visual Investor
- VectorVest, Inc.
- Executive Premier Workshop
- One-Day Options Course
- OptionsPro
- Retirement Income Workshop
- Sure-Fire Trading Systems (VectorVest, Inc.)
- Trading as a Business Workshop
- VectorVest 7 EOD
- VectorVest 7 RealTime/IntraDay
- VectorVest AutoTester
- VectorVest Educational Services
- VectorVest OnLine
- VectorVest Options Analyzer
- VectorVest ProGraphics v6.0
- VectorVest ProTrader 7
- VectorVest RealTime Derby Tool
- VectorVest Simulator
- VectorVest Variator
- VectorVest Watchdog
