HOT TOPICS LIST
- MACD
- Fibonacci
- RSI
- Gann
- ADXR
- Stochastics
- Volume
- Triangles
- Futures
- Cycles
- Volatility
- ZIGZAG
- MESA
- Retracement
- Aroon
INDICATORS LIST
LIST OF TOPICS
PRINT THIS ARTICLE
by Chaitali Mohile
The Dow Jones Utility Average has narrowed its move with a smaller range and increasing uncertainty in market. The positive divergence provides an optimistic view.
Position: N/A
Chaitali Mohile
Active trader in the Indian stock markets since 2003 and a full-time writer. Trading is largely based upon technical analysis.
PRINT THIS ARTICLE
TRIANGLES
Dow Jones Utility Average Waits For The Breakout
09/26/07 05:51:24 PMby Chaitali Mohile
The Dow Jones Utility Average has narrowed its move with a smaller range and increasing uncertainty in market. The positive divergence provides an optimistic view.
Position: N/A
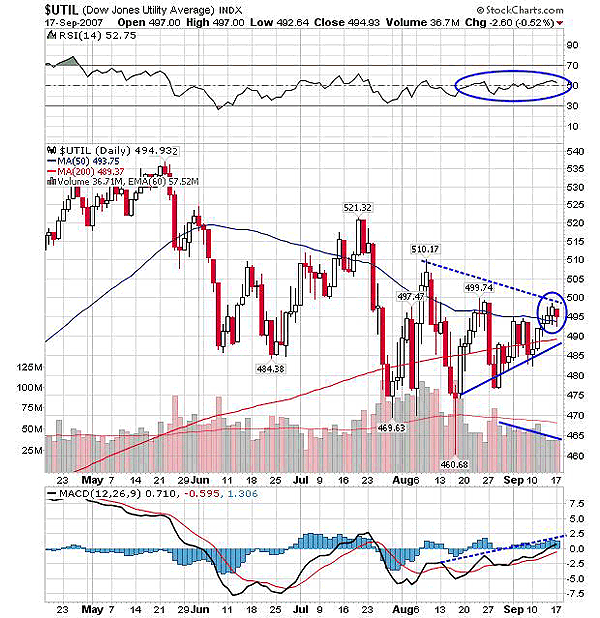
| When a symmetrical triangle is formed, traders usually prefer to take a back seat, as it is tricky to trade this triangle. The breakout direction cannot be anticipated, which makes a symmetrical triangle the odd man among the other two triangles (ascending, descending). $UTIL has moved above the 200-day moving average (MA), forming a higher low. The price is reluctant to go ahead even with the 200-day MA, as the 50-day MA resists strongly. The entire action since the last few days formed a symmetrical triangle. Here, the 50-day MA is the most appropriate resistance as the price has remained in a narrow range as the triangle moves further. The lower trendline and the 50-day MA resistance has churned the price in a highly narrow range. |
| The triangle has already turned very narrow and the price has recently moved above the 50-day MA resistance (Figure 1). For the breakout to sustain, the decreased volume needs to come roaring back to support the price action. After the 50-day MA resistance turned to support, the third day (September 17) we saw a hanging man with a low marginally below the 50-day MA. The upside breakout may halt with this hanging man. |

|
| FIGURE 1: $UTIL, DAILY. The upside breakout of the symmetrical triangle is supported by positive indicators. But the hanging man and low volume together with the event ahead may pull down the index. |
| Graphic provided by: StockCharts.com. |
| |
| The moving average convergence/divergence (MACD)(12,26,9) shows positive divergence and the relative strength index (RSI)(14) has established at 50-day level support after long volatile periods. This hints to an upside breakout, which we could see in Figure 1, happened only recently. But the hanging man formation at the 50-day MA support and the event day can bring danger to the breakout. |
| The Dow Jones Utility Average can retrace back so it is probably a good idea to wait to confirm a breakout. The target on breakout can be measured by adding the height of triangle to the breakout level. |
Active trader in the Indian stock markets since 2003 and a full-time writer. Trading is largely based upon technical analysis.
| Company: | Independent |
| Address: | C1/3 Parth Indraprasth Towers. Vastrapur |
| Ahmedabad, Guj 380015 | |
| E-mail address: | chaitalimohile@yahoo.co.in |
Traders' Resource Links | |
| Independent has not added any product or service information to TRADERS' RESOURCE. | |
Click here for more information about our publications!
Comments

Request Information From Our Sponsors
- StockCharts.com, Inc.
- Candle Patterns
- Candlestick Charting Explained
- Intermarket Technical Analysis
- John Murphy on Chart Analysis
- John Murphy's Chart Pattern Recognition
- John Murphy's Market Message
- MurphyExplainsMarketAnalysis-Intermarket Analysis
- MurphyExplainsMarketAnalysis-Visual Analysis
- StockCharts.com
- Technical Analysis of the Financial Markets
- The Visual Investor
- VectorVest, Inc.
- Executive Premier Workshop
- One-Day Options Course
- OptionsPro
- Retirement Income Workshop
- Sure-Fire Trading Systems (VectorVest, Inc.)
- Trading as a Business Workshop
- VectorVest 7 EOD
- VectorVest 7 RealTime/IntraDay
- VectorVest AutoTester
- VectorVest Educational Services
- VectorVest OnLine
- VectorVest Options Analyzer
- VectorVest ProGraphics v6.0
- VectorVest ProTrader 7
- VectorVest RealTime Derby Tool
- VectorVest Simulator
- VectorVest Variator
- VectorVest Watchdog
