HOT TOPICS LIST
- MACD
- Fibonacci
- RSI
- Gann
- ADXR
- Stochastics
- Volume
- Triangles
- Futures
- Cycles
- Volatility
- ZIGZAG
- MESA
- Retracement
- Aroon
INDICATORS LIST
LIST OF TOPICS
PRINT THIS ARTICLE
by David Penn
A 2B bottom in the second half of August is confirmed by positive divergences, sending December cotton soaring into September.
Position: N/A
David Penn
Technical Writer for Technical Analysis of STOCKS & COMMODITIES magazine, Working-Money.com, and Traders.com Advantage.
PRINT THIS ARTICLE
REVERSAL
2B Bottoms And Positive Divergences: Cotton's August Bounce Buoys Commodity
09/19/07 09:00:21 AMby David Penn
A 2B bottom in the second half of August is confirmed by positive divergences, sending December cotton soaring into September.
Position: N/A
| I've become a pretty big fan of looking at price charts with nothing on them but Japanese candlesticks. Although I have a set of technical indicators that I feel I can trust and understand a great deal, I know that sometimes indicators can be wrong — or late — and that often the message a trader needs to hear from a market is best delivered straight, no indicator. This is especially the case when looking to exit momentum trades. |
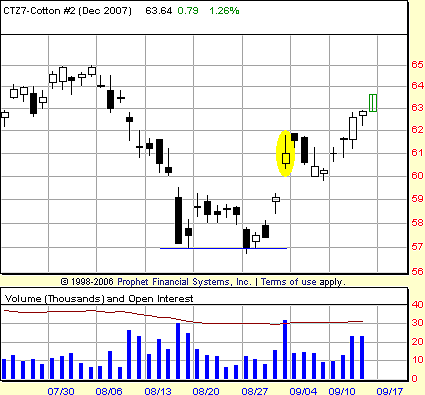
| Here, however, I want to compare entries. The first entry is based solely on candlestick lines and the patterns they create (both traditional candlestick patterns and Western patterns). Looking at the chart of December cotton in Figure 1 through this lens, I was struck by the 2B bottom that formed in mid-August after the commodity had fallen some eight cents from its late July high to its mid-August low. |

|
| FIGURE 1: COTTON, DECEMBER FUTURES, DAILY. A 2B bottom develops at the end of this correction in December cotton. The confirming close for the 2B reversal comes four days after the second lower low is made in late August. The highlighted oval represents the session during which the confirming close occurred. |
| Graphic provided by: Prophet Financial, Inc. |
| |
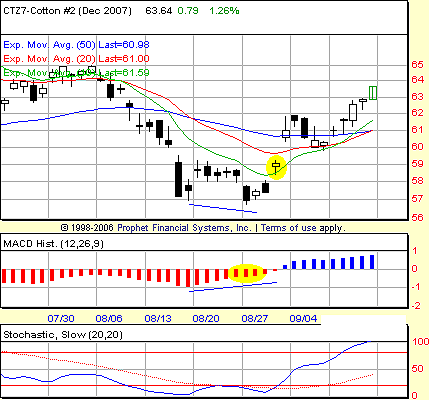
| The most basic way to enter a 2B bottom trade is to wait for the market to close above the highest high of the 2B pattern. By that, I mean that the trader needs to look at the highs of the sessions where both the initial low and the lower low were made. When the market closes above the higher of those two highs, the trader can confidently pursue the 2B bottom reversal trade. In the instance of December cotton in Figure 1, that confirming close arrived four days after the second low. This provided for an entry at approximately 60.97. But then let's look at the same setup, only adding in indicators like the moving average convergence/divergence (MACD) histogram and the stochastic (Figure 2). With these indicators added, we can see that our 2B bottom also marks a positive divergence — a positive divergence confirmed by both the MACDH and the stochastic. The rules for trading divergences are virtually the same as trading any other opportunity: first there is a signal, the suggestion that a tradable move is about to come, then there is the confirming close, which "proves" that the market is capable of moving in the desired direction. |

|
| FIGURE 2: COTTON, DECEMBER FUTURES, DAILY. Positive divergences in both the stochastic and the MACD histogram helped traders enter this reversal one session before the entry signaled by the 2B bottom shown in Figure 1. |
| Graphic provided by: Prophet Financial, Inc. |
| |
| The entry provided by the positive divergence in the stochastic is identical to the one provided by the 2B bottom. The stochastic gives a signal on August 30 when the indicator curls up to make the second, higher low. That signal receives a confirming close on August 31. Again, just like the 2B bottom entry. Compare, on the other hand, the entry suggested by the MACD histogram. The MACD histogram makes its low on August 17 and begins moving higher as the market for December cotton moves lower. However, this string of shallower histogram bars is interrupted on August 27, when deeper MACDH bar is created. This bar accompanied the lower low of the cotton 2B bottom. When the histogram resumed its pattern of shallower bars, it left behind a completed higher low in the histogram (vis-a-vis the MACDH low of August 17). It also created a bullish PpP pattern. |
| In this instance, the confirming close would come with the first close above the high of the session characterized by the last "P" in the PpP pattern. That session was August 28, with a high of 57.60. The confirming close arrived two days later, on August 30 at 59.07 — almost two cents lower than the entries suggested by the 2B alone and the stochastic. Both entries would have made for profitable trades. The former entry at 60.97 (the 2B/stochastic entry) would have forced the trader to suffer through a maximum drawdown to about the 59.80-cent area ($585 per contract) before the trade would have become seriously profitable. In fact, three days after that maximum drawdown (and that drawdown was intraday, not on the close), December cotton was closing at 62.57, which would have represented a gain of some $800 per contract. By contrast, the latter entry at 59.07 would have spared traders that anxiety. |
Technical Writer for Technical Analysis of STOCKS & COMMODITIES magazine, Working-Money.com, and Traders.com Advantage.
| Title: | Technical Writer |
| Company: | Technical Analysis, Inc. |
| Address: | 4757 California Avenue SW |
| Seattle, WA 98116 | |
| Phone # for sales: | 206 938 0570 |
| Fax: | 206 938 1307 |
| Website: | www.Traders.com |
| E-mail address: | DPenn@traders.com |
Traders' Resource Links | |
| Charting the Stock Market: The Wyckoff Method -- Books | |
| Working-Money.com -- Online Trading Services | |
| Traders.com Advantage -- Online Trading Services | |
| Technical Analysis of Stocks & Commodities -- Publications and Newsletters | |
| Working Money, at Working-Money.com -- Publications and Newsletters | |
| Traders.com Advantage -- Publications and Newsletters | |
| Professional Traders Starter Kit -- Software | |
Click here for more information about our publications!
Comments

Request Information From Our Sponsors
- StockCharts.com, Inc.
- Candle Patterns
- Candlestick Charting Explained
- Intermarket Technical Analysis
- John Murphy on Chart Analysis
- John Murphy's Chart Pattern Recognition
- John Murphy's Market Message
- MurphyExplainsMarketAnalysis-Intermarket Analysis
- MurphyExplainsMarketAnalysis-Visual Analysis
- StockCharts.com
- Technical Analysis of the Financial Markets
- The Visual Investor
- VectorVest, Inc.
- Executive Premier Workshop
- One-Day Options Course
- OptionsPro
- Retirement Income Workshop
- Sure-Fire Trading Systems (VectorVest, Inc.)
- Trading as a Business Workshop
- VectorVest 7 EOD
- VectorVest 7 RealTime/IntraDay
- VectorVest AutoTester
- VectorVest Educational Services
- VectorVest OnLine
- VectorVest Options Analyzer
- VectorVest ProGraphics v6.0
- VectorVest ProTrader 7
- VectorVest RealTime Derby Tool
- VectorVest Simulator
- VectorVest Variator
- VectorVest Watchdog
