HOT TOPICS LIST
- MACD
- Fibonacci
- RSI
- Gann
- ADXR
- Stochastics
- Volume
- Triangles
- Futures
- Cycles
- Volatility
- ZIGZAG
- MESA
- Retracement
- Aroon
INDICATORS LIST
LIST OF TOPICS
PRINT THIS ARTICLE
by David Penn
A bullish pattern in the MACDH develops just as the December contract closes over its 50-day EMA, signaling an opportunity to the upside in bean meal.
Position: N/A
David Penn
Technical Writer for Technical Analysis of STOCKS & COMMODITIES magazine, Working-Money.com, and Traders.com Advantage.
PRINT THIS ARTICLE
MACD
PpP Patterns And The MACD Histogram: Soybean Meal Makes Its Move
09/19/07 08:47:57 AMby David Penn
A bullish pattern in the MACDH develops just as the December contract closes over its 50-day EMA, signaling an opportunity to the upside in bean meal.
Position: N/A
| One of the things I like most about using the moving average convergence/divergence (MACD) histogram patterns is that I can instantly tell whether a buying or selling opportunity exists in a market (see my pair of articles, "Trading The MACD Histogram, Part I" and "Trading The MACD Histogram, Part II," from December 2006 in Working-Money.com). |
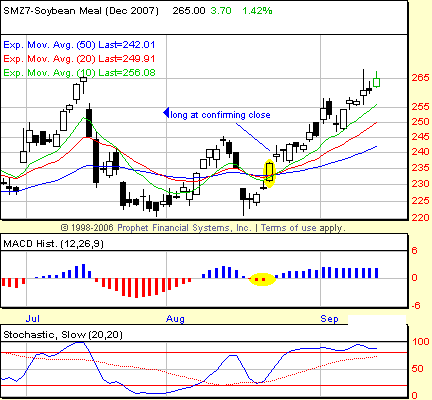
| With a few basic rules — such as using the 50-period exponential average (EMA) to separate buying opportunities from selling opportunities — the MACDH has become one of my favorite technical indicators. Consider the opportunity the MACDH revealed in Figure 1, the chart of December soybean meal futures. |

|
| FIGURE 1: SOYBEAN MEAL, DECEMBER FUTURES, DAILY. A bullish PpP pattern develops in mid-August as the market for December soybean meal rallies and closes above a trio of exponential moving averages including the key 50-day EMA. Follow-through to the upside in the form of a higher close signaled to bean meal traders that the time to get long had arrived. |
| Graphic provided by: Prophet Financial, Inc. |
| |
| Bean meal had been in a bear market since mid-July when, after peaking out near $265 per ton, the commodity fell to nearly $220 per ton a month by the end of the month. A failed rally in the first half of August led to a retesting of the July lows. This retest did not provide a positive divergence, but it did represent a higher low vis-a-vis July, opening the door to the possibility that the correction was over. A significant sign in pointing in that direction would be for bean meal to close above the August highs near $245. But even before doing this, the market for December bean meal was hinting that there was an opportunity to the upside even before that August high was tested. This hint came in the form of a bullish PpP pattern in the MACD histogram over the sessions dated August 20–22 with histogram readings of -0.650, -0.671, and -0.042, respectively. This pattern is bullish when the final session closes above the 50-period EMA, which was the case with December bean meal on August 22. |
| However, what turns this from a bullish signal into a bullish trade is the confirming close. A confirming close occurs when the market provides a bullish or bearish signal and then follows through with a close above the high of the session when the bullish signal occurred or below the low of the session when the bearish signal occurred. To be sure, there are many profitable trades that can be made without waiting for a confirming close. However, there is an added surety when the market has actually shown the ability to move in the desired direction, rather than just hinting at the possibility of such a move as is the case when we have the signal but not yet the confirming close. |
| In the case of December soybean meal shown in Figure 1, the confirming close came one day after the completed PpP pattern in the MACD histogram. Specifically, that close was on August 23 at $239.60. Five days later, with a maximum drawdown to $237 (approximately $260 per contract), December soybean meal was closing at $246.60 (approximately $700 per contract) and on-balance has been moving higher ever since. |
Technical Writer for Technical Analysis of STOCKS & COMMODITIES magazine, Working-Money.com, and Traders.com Advantage.
| Title: | Technical Writer |
| Company: | Technical Analysis, Inc. |
| Address: | 4757 California Avenue SW |
| Seattle, WA 98116 | |
| Phone # for sales: | 206 938 0570 |
| Fax: | 206 938 1307 |
| Website: | www.Traders.com |
| E-mail address: | DPenn@traders.com |
Traders' Resource Links | |
| Charting the Stock Market: The Wyckoff Method -- Books | |
| Working-Money.com -- Online Trading Services | |
| Traders.com Advantage -- Online Trading Services | |
| Technical Analysis of Stocks & Commodities -- Publications and Newsletters | |
| Working Money, at Working-Money.com -- Publications and Newsletters | |
| Traders.com Advantage -- Publications and Newsletters | |
| Professional Traders Starter Kit -- Software | |
Click here for more information about our publications!
Comments

Request Information From Our Sponsors
- VectorVest, Inc.
- Executive Premier Workshop
- One-Day Options Course
- OptionsPro
- Retirement Income Workshop
- Sure-Fire Trading Systems (VectorVest, Inc.)
- Trading as a Business Workshop
- VectorVest 7 EOD
- VectorVest 7 RealTime/IntraDay
- VectorVest AutoTester
- VectorVest Educational Services
- VectorVest OnLine
- VectorVest Options Analyzer
- VectorVest ProGraphics v6.0
- VectorVest ProTrader 7
- VectorVest RealTime Derby Tool
- VectorVest Simulator
- VectorVest Variator
- VectorVest Watchdog
- StockCharts.com, Inc.
- Candle Patterns
- Candlestick Charting Explained
- Intermarket Technical Analysis
- John Murphy on Chart Analysis
- John Murphy's Chart Pattern Recognition
- John Murphy's Market Message
- MurphyExplainsMarketAnalysis-Intermarket Analysis
- MurphyExplainsMarketAnalysis-Visual Analysis
- StockCharts.com
- Technical Analysis of the Financial Markets
- The Visual Investor
