HOT TOPICS LIST
- MACD
- Fibonacci
- RSI
- Gann
- ADXR
- Stochastics
- Volume
- Triangles
- Futures
- Cycles
- Volatility
- ZIGZAG
- MESA
- Retracement
- Aroon
INDICATORS LIST
LIST OF TOPICS
PRINT THIS ARTICLE
by Dennis D. Peterson
Changing the time frame of a chart can often reveal trends, resistance and support more easily.
Position: N/A
Dennis D. Peterson
Market index trading on a daily basis.
PRINT THIS ARTICLE
SUPPORT & RESISTANCE
Nasdaq Resistance and Support
01/18/01 02:27:53 PMby Dennis D. Peterson
Changing the time frame of a chart can often reveal trends, resistance and support more easily.
Position: N/A
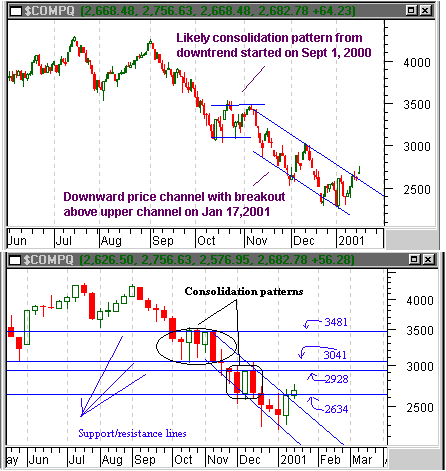
| Often daily data will obscure trends as well as resistance and support because of the noise. Using weekly data often solves the problem. The top chart of Figure 1 shows the recent activity of the Nasdaq using a daily chart. |
| In an earlier posting (Aroon and the Nasdaq Composite, 1/16/01) I tried to validate a consolidation in the mid-October to mid-November time frame using Aroon. I used daily data. When weekly data is plotted the picture becomes clearer. The bottom chart of Figure 1 charts the Nasdaq composite using weekly data and using a semi-log scale. |

|
| Figure 1: The Nasdaq composite charted using daily data with a standard arithmetic scale (top chart) and weekly data with a semilog scale (bottom chart). |
| Graphic provided by: MetaStock. |
| Graphic provided by: Data vendor: eSignal<. |
| |
| A number of observations can be made: 1. A Nasdaq consolidation is evident in October. 2. The first three candles for the October consolidation all have long lower shadows indicating the market wants to go down. In fact, using the shadow lengths, a descending right triangle nearly formed. 3. A second consolidation occurred in December. 4. The current activity is not a consolidation. 5. The Nasdaq has broken above a resistance line at 2634. 6. The next hurdles are 2698, 3041, and finally 3481. Why bother with these kind of observations? Some of the best trading strategies, such as those following Gann ideas, require knowing whether an equity is in an uptrend or downtrend. In the case of Gann you also want to know what the swing channels are. Uptrends in Gann terminology require knowing whether the nearest peak has been taken out, and downtrends whether the nearest valley has been taken out. Swing direction changes to up when two consecutive highs are encountered and changes to down when two consecutive lows are encountered. What Gann proposed, in effect, was using the trend and the swings to identify the framework for buying and selling. Trends require more time to develop than swings. Changing time frame often makes trend identification easier and therefore more reliable. |
Market index trading on a daily basis.
| Title: | Staff Writer |
| Company: | Technical Analysis, Inc. |
| Address: | 4757 California Ave SW |
| Seattle, WA 98116-4499 | |
| Phone # for sales: | 206 938 0570 |
| Fax: | 206 938 1307 |
| Website: | www.traders.com |
| E-mail address: | dpeterson@traders.com |
Traders' Resource Links | |
| Charting the Stock Market: The Wyckoff Method -- Books | |
| Working-Money.com -- Online Trading Services | |
| Traders.com Advantage -- Online Trading Services | |
| Technical Analysis of Stocks & Commodities -- Publications and Newsletters | |
| Working Money, at Working-Money.com -- Publications and Newsletters | |
| Traders.com Advantage -- Publications and Newsletters | |
| Professional Traders Starter Kit -- Software | |
Click here for more information about our publications!
Comments
Date: / /Rank: 4Comment:
Date: 02/03/01Rank: 1Comment:
Date: 06/21/03Rank: 4Comment:

Request Information From Our Sponsors
- VectorVest, Inc.
- Executive Premier Workshop
- One-Day Options Course
- OptionsPro
- Retirement Income Workshop
- Sure-Fire Trading Systems (VectorVest, Inc.)
- Trading as a Business Workshop
- VectorVest 7 EOD
- VectorVest 7 RealTime/IntraDay
- VectorVest AutoTester
- VectorVest Educational Services
- VectorVest OnLine
- VectorVest Options Analyzer
- VectorVest ProGraphics v6.0
- VectorVest ProTrader 7
- VectorVest RealTime Derby Tool
- VectorVest Simulator
- VectorVest Variator
- VectorVest Watchdog
- StockCharts.com, Inc.
- Candle Patterns
- Candlestick Charting Explained
- Intermarket Technical Analysis
- John Murphy on Chart Analysis
- John Murphy's Chart Pattern Recognition
- John Murphy's Market Message
- MurphyExplainsMarketAnalysis-Intermarket Analysis
- MurphyExplainsMarketAnalysis-Visual Analysis
- StockCharts.com
- Technical Analysis of the Financial Markets
- The Visual Investor
