HOT TOPICS LIST
- MACD
- Fibonacci
- RSI
- Gann
- ADXR
- Stochastics
- Volume
- Triangles
- Futures
- Cycles
- Volatility
- ZIGZAG
- MESA
- Retracement
- Aroon
INDICATORS LIST
LIST OF TOPICS
PRINT THIS ARTICLE
by David Penn
A MmM pattern in the MACD histogram hints at a buying opportunity as December bean oil rallies into September.
Position: N/A
David Penn
Technical Writer for Technical Analysis of STOCKS & COMMODITIES magazine, Working-Money.com, and Traders.com Advantage.
PRINT THIS ARTICLE
BREAKOUTS
Overbought Breakout Sends Bean Oil Toward Contract Highs
09/12/07 10:23:14 AMby David Penn
A MmM pattern in the MACD histogram hints at a buying opportunity as December bean oil rallies into September.
Position: N/A
| One of the most important things for market technicians to remember is that often, a market is most attractive when it becomes overbought. This flies in the face of a significant amount of conventional wisdom, if not common sense. Generally speaking — and certainly in conversation — a market that is determined to be overbought, or in danger of becoming overbought, is a market that more often than not traders and investors are cautioned to avoid. |
| To be fair, there are times when an overbought market should not be bought, such as when a market also is rallying toward a fairly clear resistance level. However, there are at least as many instances in which overbought markets can and should be bought. Take a look at any enduring trend and you are likely to see a market that became overbought and stayed that way as prices were bid higher and higher. The only way to reliably and consistently participate in such markets is to look for and pursue markets just as they are becoming overbought — not in shunning them. |

|
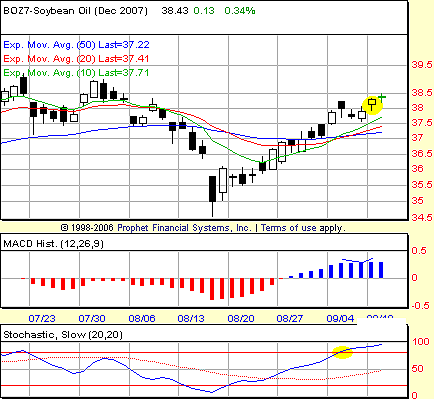
| FIGURE 1: SOYBEAN OIL, DECEMBER FUTURES, DAILY. The highlighted oval in the lowermost panel reveals the overbought (BOSO) breakout in the stochastic. The middle panel shows the bullish MmM pattern in the MACD histogram. In the price panel, we can see highlighted the session that represented the final “M” in the MmM pattern. A close above this high triggered a long entry in December bean oil. |
| Graphic provided by: Prophet Financial, Inc. |
| |
| That said, it certainly doesn't hurt to have confirmation from other indicators or technical signs that a market move higher — even strongly higher — should be bought. In the case here of December soybean oil, longside traders are fortunate enough to have just such confirmation in the form of a confirmed MmM pattern in the moving average convergence/divergence (MACD) histogram. See Figure 1. |
| I have written a great deal over the past year about patterns and the MACD histogram in articles for Traders.com Advantage and Working-Money.com. The MmM pattern, which Alexander Elder first alerted me to in his book Trading For A Living, is one of the key bullish patterns in the MACD histogram. It occurs when the oscillator is in positive territory (that is, above the zero line) and is called "MmM" because of the way the histogram goes from a higher bar to a lower bar and then back, resembling the letters M-m-M. |
| Confirmation of the bullish MmM pattern occurs when prices close above the high of the last "M" session. Here, with December bean oil, that last "M" session occurred on September 10. Confirmation, in the form of a higher close, came one day later on September 11. One last word: It could be argued that the pattern is less "MmM" and more "MmmM." It really does not matter. What is key is that there is a three-bar sequence that goes from higher to lower, back to higher. That is the sequence that completes the pattern and sets the market up to await confirmation. |
Technical Writer for Technical Analysis of STOCKS & COMMODITIES magazine, Working-Money.com, and Traders.com Advantage.
| Title: | Technical Writer |
| Company: | Technical Analysis, Inc. |
| Address: | 4757 California Avenue SW |
| Seattle, WA 98116 | |
| Phone # for sales: | 206 938 0570 |
| Fax: | 206 938 1307 |
| Website: | www.Traders.com |
| E-mail address: | DPenn@traders.com |
Traders' Resource Links | |
| Charting the Stock Market: The Wyckoff Method -- Books | |
| Working-Money.com -- Online Trading Services | |
| Traders.com Advantage -- Online Trading Services | |
| Technical Analysis of Stocks & Commodities -- Publications and Newsletters | |
| Working Money, at Working-Money.com -- Publications and Newsletters | |
| Traders.com Advantage -- Publications and Newsletters | |
| Professional Traders Starter Kit -- Software | |
Click here for more information about our publications!
Comments

|

Request Information From Our Sponsors
- StockCharts.com, Inc.
- Candle Patterns
- Candlestick Charting Explained
- Intermarket Technical Analysis
- John Murphy on Chart Analysis
- John Murphy's Chart Pattern Recognition
- John Murphy's Market Message
- MurphyExplainsMarketAnalysis-Intermarket Analysis
- MurphyExplainsMarketAnalysis-Visual Analysis
- StockCharts.com
- Technical Analysis of the Financial Markets
- The Visual Investor
- VectorVest, Inc.
- Executive Premier Workshop
- One-Day Options Course
- OptionsPro
- Retirement Income Workshop
- Sure-Fire Trading Systems (VectorVest, Inc.)
- Trading as a Business Workshop
- VectorVest 7 EOD
- VectorVest 7 RealTime/IntraDay
- VectorVest AutoTester
- VectorVest Educational Services
- VectorVest OnLine
- VectorVest Options Analyzer
- VectorVest ProGraphics v6.0
- VectorVest ProTrader 7
- VectorVest RealTime Derby Tool
- VectorVest Simulator
- VectorVest Variator
- VectorVest Watchdog
