HOT TOPICS LIST
- MACD
- Fibonacci
- RSI
- Gann
- ADXR
- Stochastics
- Volume
- Triangles
- Futures
- Cycles
- Volatility
- ZIGZAG
- MESA
- Retracement
- Aroon
INDICATORS LIST
LIST OF TOPICS
PRINT THIS ARTICLE
by David Penn
Negative divergences in the stochastic and the MACD histogram anticipated a late summer correction in lean hog futures.
Position: N/A
David Penn
Technical Writer for Technical Analysis of STOCKS & COMMODITIES magazine, Working-Money.com, and Traders.com Advantage.
PRINT THIS ARTICLE
REVERSAL
Not So High On The Hogs: Divergences And Breakdowns In The October Contract
09/11/07 10:54:13 AMby David Penn
Negative divergences in the stochastic and the MACD histogram anticipated a late summer correction in lean hog futures.
Position: N/A
| Although the odds are slight, there is a tendency for the October contract in lean hog futures to advance in July and for that July strength to be "reversed" in August, according to the Commodity Trader's Almanac. |
| It appears that 2007 will be added to those years in which these seasonal tendencies were born out. After a strong rally in lean hogs that began in earliest July, the market topped a few trading days into August. By midmonth, the market had taken away more than half of the previous month's gains. |

|
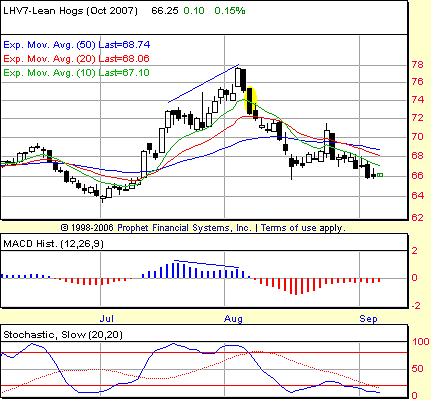
| FIGURE 1: LEAN HOGS, OCTOBER FUTURES, DAILY. The negative divergence in the MACD histogram was mirrored by a negative divergence in the stochastic just as the October lean hogs contract was rallying into August. These negative divergences helped prepare traders for the downside that followed over the balance of the month. The highlighted oval represents the session during which the negative divergences were confirmed as of the close. |
| Graphic provided by: Prophet Financial, Inc. |
| |
| In addition to the seasonal tendencies toward August weakness following July strength, the technical indicators helped traders anticipate that August would likely not resemble the previous month. Foremost among these indicators was the moving average convergence/divergence histogram (MACDH), which revealed a negative divergence between the mid-July high and the high in the first few trading days of August (see Figure 1). This negative divergence, when prices made higher highs while the indicators made lower highs, was confirmed by the stochastic, which also made lower highs while prices were making higher highs. |
| At a minimum, this was a signal for long-side traders to reduce their exposure to the market for lean hogs. More aggressively, traders who wanted to bet against the rally in lean hogs now had their signal. All that would be required to set those short trades in motion would be a confirming close. |
| That confirming close came shortly afterward. The MACDH ticked down, completing the negative divergence on August 6. A confirming close would occur when the market closed below the low of that August 6th session. As it happened, that confirming close took place on the following session, August 7, at approximately 72.575. As of the close five days later, October lean hogs were trading at 69.80. That 277-point move was worth approximately $1,108 per contract, with minimal drawdown along the way. |
Technical Writer for Technical Analysis of STOCKS & COMMODITIES magazine, Working-Money.com, and Traders.com Advantage.
| Title: | Technical Writer |
| Company: | Technical Analysis, Inc. |
| Address: | 4757 California Avenue SW |
| Seattle, WA 98116 | |
| Phone # for sales: | 206 938 0570 |
| Fax: | 206 938 1307 |
| Website: | www.Traders.com |
| E-mail address: | DPenn@traders.com |
Traders' Resource Links | |
| Charting the Stock Market: The Wyckoff Method -- Books | |
| Working-Money.com -- Online Trading Services | |
| Traders.com Advantage -- Online Trading Services | |
| Technical Analysis of Stocks & Commodities -- Publications and Newsletters | |
| Working Money, at Working-Money.com -- Publications and Newsletters | |
| Traders.com Advantage -- Publications and Newsletters | |
| Professional Traders Starter Kit -- Software | |
Click here for more information about our publications!
Comments

Request Information From Our Sponsors
- StockCharts.com, Inc.
- Candle Patterns
- Candlestick Charting Explained
- Intermarket Technical Analysis
- John Murphy on Chart Analysis
- John Murphy's Chart Pattern Recognition
- John Murphy's Market Message
- MurphyExplainsMarketAnalysis-Intermarket Analysis
- MurphyExplainsMarketAnalysis-Visual Analysis
- StockCharts.com
- Technical Analysis of the Financial Markets
- The Visual Investor
- VectorVest, Inc.
- Executive Premier Workshop
- One-Day Options Course
- OptionsPro
- Retirement Income Workshop
- Sure-Fire Trading Systems (VectorVest, Inc.)
- Trading as a Business Workshop
- VectorVest 7 EOD
- VectorVest 7 RealTime/IntraDay
- VectorVest AutoTester
- VectorVest Educational Services
- VectorVest OnLine
- VectorVest Options Analyzer
- VectorVest ProGraphics v6.0
- VectorVest ProTrader 7
- VectorVest RealTime Derby Tool
- VectorVest Simulator
- VectorVest Variator
- VectorVest Watchdog
