HOT TOPICS LIST
- MACD
- Fibonacci
- RSI
- Gann
- ADXR
- Stochastics
- Volume
- Triangles
- Futures
- Cycles
- Volatility
- ZIGZAG
- MESA
- Retracement
- Aroon
INDICATORS LIST
LIST OF TOPICS
PRINT THIS ARTICLE
by Chaitali Mohile
A strong technology stock like Apple, Inc., can go jittery when volatility returns to the NASDAQ Composite.
Position: N/A
Chaitali Mohile
Active trader in the Indian stock markets since 2003 and a full-time writer. Trading is largely based upon technical analysis.
PRINT THIS ARTICLE
CANDLESTICK CHARTING
Apple Struggles Near Support
09/11/07 11:59:01 AMby Chaitali Mohile
A strong technology stock like Apple, Inc., can go jittery when volatility returns to the NASDAQ Composite.
Position: N/A
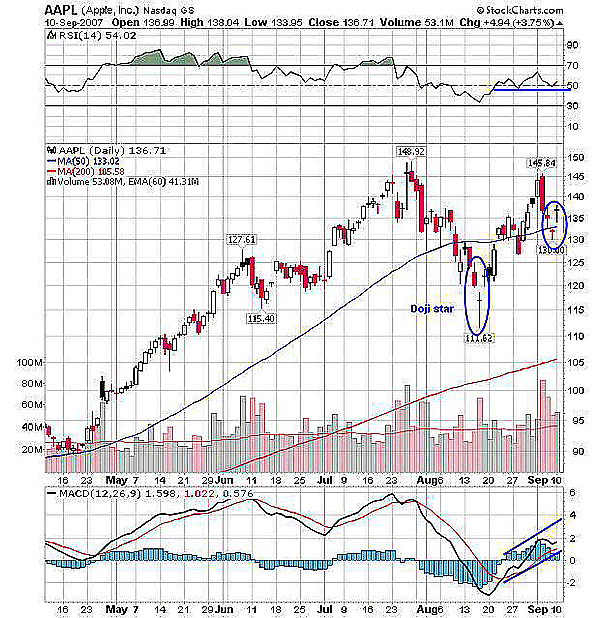
| The correction that began at the highest level of $148 in Apple, Inc., moved below the 50-day moving average (MA) support and gradually closed at the low of $111.62. Here, a trend reversal was indicated when a doji star was formed. The first red candle in Figure 1 indicates the existing trend that is in a downtrend. The second day was gap down, closing near the open. This formed a red doji, which completes the doji star pattern in a downtrend perfectly. This pattern indicates that the trend is about to change. The effect is clearly seen on the chart. The stock rallied from $111 to $145. |
| Apart from the doji star, one gap up doji is also marked in the circle. Instead of a doji, if the third candle could have been bullish within the body of a bearish first candle, then a morning star would have formed. The morning star is a bullish reversal pattern and indicates an upside move. In any case, the gap up doji was followed by an upside move, giving more importance to the doji star. And a previous high was within reach. |

|
| FIGURE 1: APPLE, INC., DAILY. With the doji star, the bulls rallied up to the 145 level. The group of three doji indicates an uncertain move in the current market situation. |
| Graphic provided by: StockCharts.com. |
| |
| In the last few days the volatility in the financial market was back again, scaring the bulls. The NASDAQ Composite was under turbulence again, naturally affecting its technology stocks. Apple, Inc., was not exceptional in the technology group. As a result, the stock's upward journey halted at $145. Now, Apple, Inc., is trying to sustain close to its 50-day MA support. A group of doji candles were being formed in the last three days. The clouds of uncertainty have gathered again around the stock. |
| The indicators are positively holding a bullish position. Only the domestic trouble in the overall market can change the picture. The price is reacting in an uncertain way even on positive bullish indicators. |
Active trader in the Indian stock markets since 2003 and a full-time writer. Trading is largely based upon technical analysis.
| Company: | Independent |
| Address: | C1/3 Parth Indraprasth Towers. Vastrapur |
| Ahmedabad, Guj 380015 | |
| E-mail address: | chaitalimohile@yahoo.co.in |
Traders' Resource Links | |
| Independent has not added any product or service information to TRADERS' RESOURCE. | |
Click here for more information about our publications!
Comments
Date: 09/11/07Rank: 4Comment:
Date: 09/11/07Rank: 4Comment:

Request Information From Our Sponsors
- StockCharts.com, Inc.
- Candle Patterns
- Candlestick Charting Explained
- Intermarket Technical Analysis
- John Murphy on Chart Analysis
- John Murphy's Chart Pattern Recognition
- John Murphy's Market Message
- MurphyExplainsMarketAnalysis-Intermarket Analysis
- MurphyExplainsMarketAnalysis-Visual Analysis
- StockCharts.com
- Technical Analysis of the Financial Markets
- The Visual Investor
- VectorVest, Inc.
- Executive Premier Workshop
- One-Day Options Course
- OptionsPro
- Retirement Income Workshop
- Sure-Fire Trading Systems (VectorVest, Inc.)
- Trading as a Business Workshop
- VectorVest 7 EOD
- VectorVest 7 RealTime/IntraDay
- VectorVest AutoTester
- VectorVest Educational Services
- VectorVest OnLine
- VectorVest Options Analyzer
- VectorVest ProGraphics v6.0
- VectorVest ProTrader 7
- VectorVest RealTime Derby Tool
- VectorVest Simulator
- VectorVest Variator
- VectorVest Watchdog
