HOT TOPICS LIST
- MACD
- Fibonacci
- RSI
- Gann
- ADXR
- Stochastics
- Volume
- Triangles
- Futures
- Cycles
- Volatility
- ZIGZAG
- MESA
- Retracement
- Aroon
INDICATORS LIST
LIST OF TOPICS
PRINT THIS ARTICLE
by Chaitali Mohile
$RUT failed to overcome the bearish force even during a pullback rally in the entire market. Now we're likely to see its previous low.
Position: Sell
Chaitali Mohile
Active trader in the Indian stock markets since 2003 and a full-time writer. Trading is largely based upon technical analysis.
PRINT THIS ARTICLE
BULL/BEAR MARKET
Russell 2000 Is Underperforming
09/11/07 11:37:46 AMby Chaitali Mohile
$RUT failed to overcome the bearish force even during a pullback rally in the entire market. Now we're likely to see its previous low.
Position: Sell
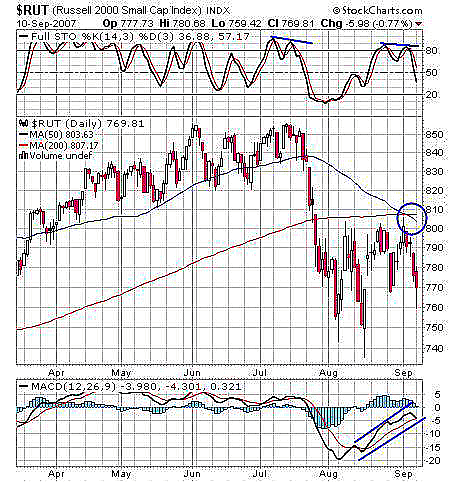
| In my previous article on the Russell 2000 (June 26 for Traders.com Advantage), I pointed at negative divergence and rising wedge on the weekly chart. Thereafter, the Russell 2000 small cap index plunged hard. Even now, the daily chart (Figure 1) indicates further downside and some other bearish indication on intraday charts as well. |
| According to Figure 1, $RUT came under the resistance of 50- and 200-day moving averages after a slump in July. The US markets witnessed a marginal pullback in a few trading sessions in August, but $RUT failed to join the rally. Instead, it recovered from its previous low of 740 and hit resistance at the 200-day moving average (MA). With every retest of this resistance, the index made higher lows but could not find its way out. The second, new bearish indication now is a bearish moving average crossover. In early September, the 50-day MA has moved below the 200-day MA, an indication that bears are more powerful here. The $RUT has already rallied down 50 points from the 810 resistance level, while this new bearish pressure may drag the index toward its previous low. |

|
| FIGURE 1: $RUT, DAILY. The bearish moving average crossover may add further weakness in the index. |
| Graphic provided by: StockCharts.com. |
| |
| In addition, the stochastic (14,3,3) is on its trip down after the double-top formation around the 80 level. Previously, when the double top was formed at ~ 90 (the highly overbought level), the price had a nose dive of 100 points. So I anticipate $RUT may test a minimum downside of 740 (the previous low). The moving average convergence/divergence (MACD)(12,26,9) is ready for a bearish crossover and histogram has formed lower highs with the support of zero line. I see more bears coming with these negative indicators. |

|
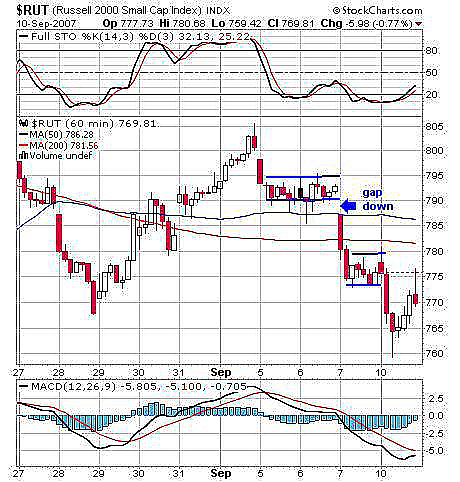
| FIGURE 2: $RUT, HOURLY. The 200-day MA is likely to resist the recovery move. And even if this hurdle is crossed, the next 50-day MA resistance could keep the index in a narrow range. |
| Graphic provided by: StockCharts.com. |
| |
| That was the bearish daily chart; the intraday chart shows bulls giving up at a hurried pace. The 60-minute chart (see Figure 2) shows a bearish flag & pennant breakout with a gap down turning two moving averages support to resistance. In the first two hours of the day, the index lost 10 points, then went through a narrow consolidation forming another bearish flag & pennant. The breakdown lost an additional 10 points. The stochastic (14,3,3) indicates the possibility of new buying positions and the MACD (12,26,9) is likely to undergo bullish crossover. So there is a chance of some bullish rally with a resistance/target at the 200-day MA or 780. |
| The intraday chart and the daily chart has various resistance that may keep bulls away from the Russell 2000 small-cap index. Thus, this tradable may continue to underperform till the hurdles are crossed on stronger notes. |
Active trader in the Indian stock markets since 2003 and a full-time writer. Trading is largely based upon technical analysis.
| Company: | Independent |
| Address: | C1/3 Parth Indraprasth Towers. Vastrapur |
| Ahmedabad, Guj 380015 | |
| E-mail address: | chaitalimohile@yahoo.co.in |
Traders' Resource Links | |
| Independent has not added any product or service information to TRADERS' RESOURCE. | |
Click here for more information about our publications!
PRINT THIS ARTICLE

Request Information From Our Sponsors
- VectorVest, Inc.
- Executive Premier Workshop
- One-Day Options Course
- OptionsPro
- Retirement Income Workshop
- Sure-Fire Trading Systems (VectorVest, Inc.)
- Trading as a Business Workshop
- VectorVest 7 EOD
- VectorVest 7 RealTime/IntraDay
- VectorVest AutoTester
- VectorVest Educational Services
- VectorVest OnLine
- VectorVest Options Analyzer
- VectorVest ProGraphics v6.0
- VectorVest ProTrader 7
- VectorVest RealTime Derby Tool
- VectorVest Simulator
- VectorVest Variator
- VectorVest Watchdog
- StockCharts.com, Inc.
- Candle Patterns
- Candlestick Charting Explained
- Intermarket Technical Analysis
- John Murphy on Chart Analysis
- John Murphy's Chart Pattern Recognition
- John Murphy's Market Message
- MurphyExplainsMarketAnalysis-Intermarket Analysis
- MurphyExplainsMarketAnalysis-Visual Analysis
- StockCharts.com
- Technical Analysis of the Financial Markets
- The Visual Investor
