

HOT TOPICS LIST
- MACD
- Fibonacci
- RSI
- Gann
- ADXR
- Stochastics
- Volume
- Triangles
- Futures
- Cycles
- Volatility
- ZIGZAG
- MESA
- Retracement
- Aroon
INDICATORS LIST
LIST OF TOPICS
PRINT THIS ARTICLE
by Chaitali Mohile
TWX moves in range under certain resistance; in addition, NYSE Composite holds onto the strong support of the moving average, and adds to the strength of the lower range of the security.
Position: N/A
Chaitali Mohile
Active trader in the Indian stock markets since 2003 and a full-time writer. Trading is largely based upon technical analysis.
PRINT THIS ARTICLE
CORRELATION ANALYSIS
Time Warner Is Bottoming Out
09/10/07 11:53:27 AMby Chaitali Mohile
TWX moves in range under certain resistance; in addition, NYSE Composite holds onto the strong support of the moving average, and adds to the strength of the lower range of the security.
Position: N/A
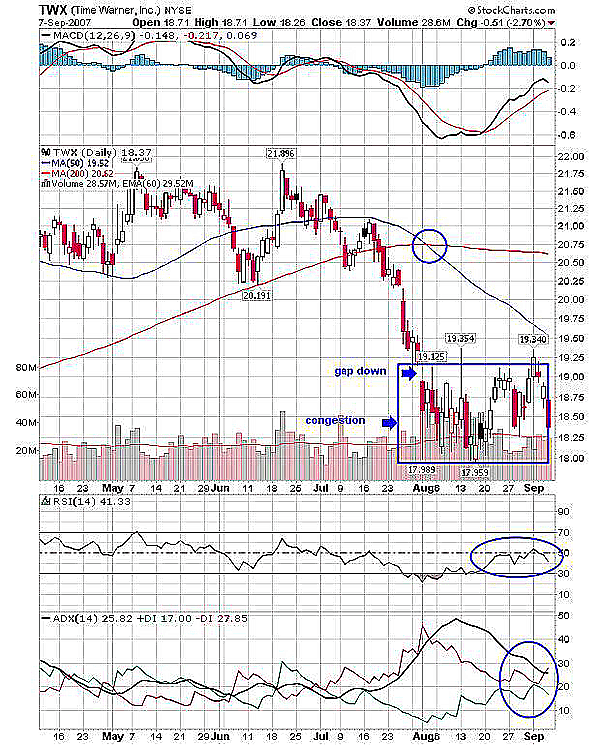
| Time Warner (TWX) is one of the most active stocks in NYSE Composite. After a nominal gap down in early August 2007, TWX remained within the $17.95-$19.125 range for almost a month, even when volatility in the market returned. This indicates the bottoming out of the stock. Bottom formation is a lower-range consolidation after a long correction. The price congestion at lower levels shows an unwillingness to correct further. The stock in this phase accumulates the strength required for directional moves; the gaps get filled whether they're up or down. In Figure 1, the gap down in early August was filled in mid-month. |
|
| FIGURE 1: TIME WARNER, DAILY. The stock is bottoming out in the range of $19–$17.95. The upside move after refilling the gap down was restricted by the 50-day moving average resistance. The price retraced back and is now on its way toward the prior low. |
| Graphic provided by: StockCharts.com. |
| |
| Meanwhile, the stock tried to violate the upper range and moved to $19.34 but was soon dragged below. This reconfirms the bottoming of the stock. The relative strength index (RSI)(14) has been trading in a 30-50 range, indicating consolidation. The strength here is supporting neither the bulls nor the bears. The moving average convergence/divergence (MACD)(12,26,9) is again tipped down after a bullish crossover in negative territory. Here, traders need to watch the next direction on the indicator. The average directional movement index (ADX)(14) also indicates consolidation to continue. |
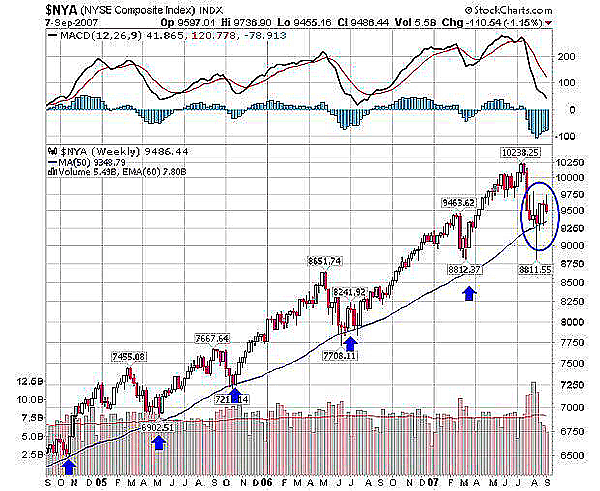
| The weekly chart (Figure 2) of the NYSE Composite, shows an amazing picture of the index. The 50 period moving average has been the strongest support throughout the past moves for the index. History shows that the new bullish rally was born after every retest of the support. The present volatility is strong even after the past correction in July. The index held its historical support again. The MACD (12,26,9) has never moved below its zero line. The current bearish crossover happened in positive territory as well. |
|
| FIGURE 2: NYSE COMPOSITE, WEEKLY. The index had retraced toward the 50-day moving average, at least once a year since 2005. The present volatile move had also established support on the 50-day moving average too. |
| Graphic provided by: StockCharts.com. |
| |
| If history repeats, the index should hold its support. With this support, TWX would be able to sustain above its lower range and trade within the upper and lower range. |
| Thus, the bottom formation of TWX is dependent on the NYSE Composite movement. Now, since volatility is back, the bottom formation can be successful if the index sustains above support. |
Active trader in the Indian stock markets since 2003 and a full-time writer. Trading is largely based upon technical analysis.
| Company: | Independent |
| Address: | C1/3 Parth Indraprasth Towers. Vastrapur |
| Ahmedabad, Guj 380015 | |
| E-mail address: | chaitalimohile@yahoo.co.in |
Traders' Resource Links | |
| Independent has not added any product or service information to TRADERS' RESOURCE. | |
Click here for more information about our publications!
PRINT THIS ARTICLE

Request Information From Our Sponsors
- StockCharts.com, Inc.
- Candle Patterns
- Candlestick Charting Explained
- Intermarket Technical Analysis
- John Murphy on Chart Analysis
- John Murphy's Chart Pattern Recognition
- John Murphy's Market Message
- MurphyExplainsMarketAnalysis-Intermarket Analysis
- MurphyExplainsMarketAnalysis-Visual Analysis
- StockCharts.com
- Technical Analysis of the Financial Markets
- The Visual Investor
- VectorVest, Inc.
- Executive Premier Workshop
- One-Day Options Course
- OptionsPro
- Retirement Income Workshop
- Sure-Fire Trading Systems (VectorVest, Inc.)
- Trading as a Business Workshop
- VectorVest 7 EOD
- VectorVest 7 RealTime/IntraDay
- VectorVest AutoTester
- VectorVest Educational Services
- VectorVest OnLine
- VectorVest Options Analyzer
- VectorVest ProGraphics v6.0
- VectorVest ProTrader 7
- VectorVest RealTime Derby Tool
- VectorVest Simulator
- VectorVest Variator
- VectorVest Watchdog