HOT TOPICS LIST
- MACD
- Fibonacci
- RSI
- Gann
- ADXR
- Stochastics
- Volume
- Triangles
- Futures
- Cycles
- Volatility
- ZIGZAG
- MESA
- Retracement
- Aroon
INDICATORS LIST
LIST OF TOPICS
PRINT THIS ARTICLE
by Koos van der Merwe
Financial events of the past few weeks have suggested that the US economy is headed for a recession. What do Gann charts have to say about it?
Position: Sell
Koos van der Merwe
Has been a technical analyst since 1969, and has worked as a futures and options trader with First Financial Futures in Johannesburg, South Africa.
PRINT THIS ARTICLE
GANN
A Gann Look At The S&P 500
09/10/07 09:21:14 AMby Koos van der Merwe
Financial events of the past few weeks have suggested that the US economy is headed for a recession. What do Gann charts have to say about it?
Position: Sell
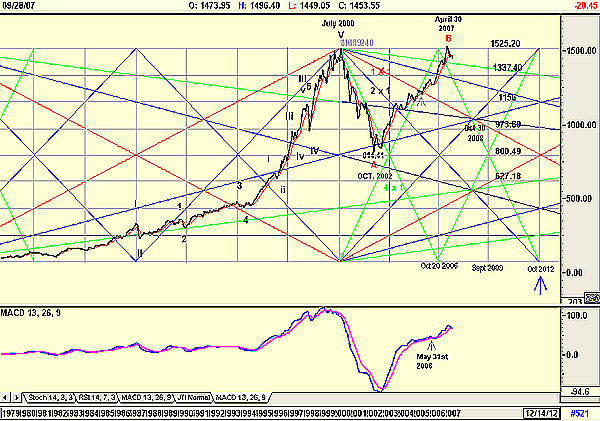
| Figure 1 is a chart that readers of my articles will be familiar with. It is a monthly chart of the Standard & Poor's 500, with an Elliott wave count, Gann fans, and a moving average convergence/divergence (MACD) indicator. It highlights the following possible future events: |

|
| FIGURE 1: S&P 500 WITH GANN LINES AND ELLIOTT WAVE COUNT, MONTHLY |
| Graphic provided by: AdvancedGET. |
| |
| a. The Elliott wave count suggests that a B-wave is complete, and that the index is probably moving into a major C-wave down. Major C-waves follow a five-impulse wave down, and the index appears to be tracing wave 1 down. This has not yet been confirmed by the MACD, which has not yet given a definite sell signal. I say "yet" because twice before, on May 31, 2006, the MACD did give a sell signal that proved to be false. Because the top of the B-wave tested the high of wave-V at 1525.20, I expect the C-wave to be flat — that is, it should bottom somewhere between the high of wave-5 at 1525.20 and the low of wave-A at 814.41. b. The chart shows the rule of 8 used in Gann charts, which is where the distance between the low and the high of the Elliott wave count is divided into eight equal parts. These horizontal lines show possible targets for the C-wave. My immediate guess is anywhere from 1156 to 627.18. c. Gann fans drawn show that the top of wave-A should have been October 20, 2006. The index actually topped out in April 2007, six months later. Using this margin of error for future time predictions I therefore expect wave- C to bottom sometime between May 2012 and April 2013. |
| My conclusion: The United States is headed for a recession is forecast by the chart. The reason for the start of the recession is now known by all. The depth of the recession is, however, unknown, but with Federal chairman Ben Bernanke at the helm of the economy of the US, we can hope that the coming recession may be mild. The Elliott wave count suggests it will not be that deep. Gann analysis, however, suggests that there are five tough years ahead. |
Has been a technical analyst since 1969, and has worked as a futures and options trader with First Financial Futures in Johannesburg, South Africa.
| Address: | 3256 West 24th Ave |
| Vancouver, BC | |
| Phone # for sales: | 6042634214 |
| E-mail address: | petroosp@gmail.com |
Click here for more information about our publications!
Comments
Date: 01/08/08Rank: 5Comment:

Request Information From Our Sponsors
- StockCharts.com, Inc.
- Candle Patterns
- Candlestick Charting Explained
- Intermarket Technical Analysis
- John Murphy on Chart Analysis
- John Murphy's Chart Pattern Recognition
- John Murphy's Market Message
- MurphyExplainsMarketAnalysis-Intermarket Analysis
- MurphyExplainsMarketAnalysis-Visual Analysis
- StockCharts.com
- Technical Analysis of the Financial Markets
- The Visual Investor
- VectorVest, Inc.
- Executive Premier Workshop
- One-Day Options Course
- OptionsPro
- Retirement Income Workshop
- Sure-Fire Trading Systems (VectorVest, Inc.)
- Trading as a Business Workshop
- VectorVest 7 EOD
- VectorVest 7 RealTime/IntraDay
- VectorVest AutoTester
- VectorVest Educational Services
- VectorVest OnLine
- VectorVest Options Analyzer
- VectorVest ProGraphics v6.0
- VectorVest ProTrader 7
- VectorVest RealTime Derby Tool
- VectorVest Simulator
- VectorVest Variator
- VectorVest Watchdog
