HOT TOPICS LIST
- MACD
- Fibonacci
- RSI
- Gann
- ADXR
- Stochastics
- Volume
- Triangles
- Futures
- Cycles
- Volatility
- ZIGZAG
- MESA
- Retracement
- Aroon
INDICATORS LIST
LIST OF TOPICS
PRINT THIS ARTICLE
by David Penn
After a descent in late November, February light crude has begun climbing . . . again.
Position: N/A
David Penn
Technical Writer for Technical Analysis of STOCKS & COMMODITIES magazine, Working-Money.com, and Traders.com Advantage.
PRINT THIS ARTICLE
MONEY FLOW INDEX
Money Flow and the Comeback of Light Crude
01/18/01 02:54:40 PMby David Penn
After a descent in late November, February light crude has begun climbing . . . again.
Position: N/A
| Was it a head and shoulders top that the February light crude contract developed over the fall of 2000? In any event, light crude prices fell beneath $30 a barrel in early December, having remained above that point for the previous three months. Many people seemed to take that move as an indication that crude oil's back had been broken, and lower crude prices were on the way. |
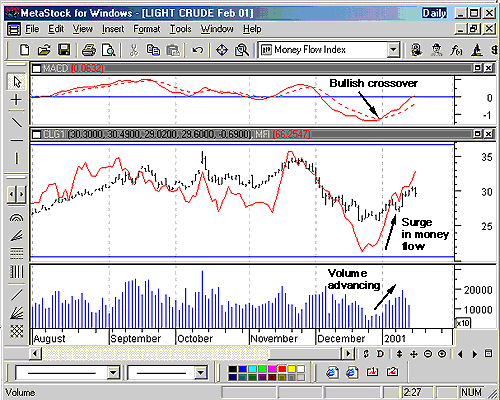
| However those bearish sentiments on crude were relatively short-lived. Light crude for February delivery sank as low as $25.50 a barrel on December 20th, then rallied on increasing volume to close at $30.20 on January 16th. While there is (as always) some mystery as to whether or not crude oil will continue to advance into (or even beyond) the low $30s, a number of indicators that helped anticipate crude's December rally may help play a role in determining where the February contract might head between now and expiration. |

|
| Between the late December surge in money flow and the MACD bullish crossover in early January, crude oil provided fair warning that the November/December declines were done. |
| Graphic provided by: MetaStock. |
| |
| The most compelling indicator at present is the money flow index, which bottomed on December 21st and has moved upward with relatively minor retracement to the present day. What is especially compelling about the money flow index--a momentum-based indicator that measures the money "flowing" in and out of the commodity--in this instance is how well it anticipated the short-term bottom of February crude. Prices continued to skid along the $25 resistance area for six trading days as traders tried to make up their minds. But on the seventh day, the short-term direction of crude oil was clear, as prices began to make the $5 climb over the $30 mark. |
| Another compelling indicator here is the moving average convergence-divergence (MACD) indicator. This indicator measures the degree from zero between a longer moving average (usually a 26-day) subtracted from a shorter moving average (usually a 12-day) to determine the MACD. Then a moving average of the MACD (usually a 9-day) is plotted and used as a signal line to initiate long or short positions. If the money flow index signaled the end of light crude's decline and the beginning of the six-day consolidation range in late December, then the MACD appears to have anticipated the beginning of the rally. The MACD (the solid line in the chart) crossed upside of the signal line (dotted) on January 2nd, a bullish development that occurred just as prices were moving out of their late December range. The fact that the MACD crossed the zero line on January 17th is a further positive sign for crude oil bulls. |
| The moving average convergence-divergence indicator can be particularly helpful in determining how meaningful recent price moves are compared to less recent price movement. But money flow is a very powerful factor, as well. After all, it is difficult for prices to advance without strong buying pressure. When a dramatic upmove occurs--as it did in late December--especially after a period of trending down, it can be worthwhile for traders to pay close attention in the event that, in fact, a bottom has formed. |
Technical Writer for Technical Analysis of STOCKS & COMMODITIES magazine, Working-Money.com, and Traders.com Advantage.
| Title: | Technical Writer |
| Company: | Technical Analysis, Inc. |
| Address: | 4757 California Avenue SW |
| Seattle, WA 98116 | |
| Phone # for sales: | 206 938 0570 |
| Fax: | 206 938 1307 |
| Website: | www.Traders.com |
| E-mail address: | DPenn@traders.com |
Traders' Resource Links | |
| Charting the Stock Market: The Wyckoff Method -- Books | |
| Working-Money.com -- Online Trading Services | |
| Traders.com Advantage -- Online Trading Services | |
| Technical Analysis of Stocks & Commodities -- Publications and Newsletters | |
| Working Money, at Working-Money.com -- Publications and Newsletters | |
| Traders.com Advantage -- Publications and Newsletters | |
| Professional Traders Starter Kit -- Software | |
Click here for more information about our publications!
Comments

|

Request Information From Our Sponsors
- StockCharts.com, Inc.
- Candle Patterns
- Candlestick Charting Explained
- Intermarket Technical Analysis
- John Murphy on Chart Analysis
- John Murphy's Chart Pattern Recognition
- John Murphy's Market Message
- MurphyExplainsMarketAnalysis-Intermarket Analysis
- MurphyExplainsMarketAnalysis-Visual Analysis
- StockCharts.com
- Technical Analysis of the Financial Markets
- The Visual Investor
- VectorVest, Inc.
- Executive Premier Workshop
- One-Day Options Course
- OptionsPro
- Retirement Income Workshop
- Sure-Fire Trading Systems (VectorVest, Inc.)
- Trading as a Business Workshop
- VectorVest 7 EOD
- VectorVest 7 RealTime/IntraDay
- VectorVest AutoTester
- VectorVest Educational Services
- VectorVest OnLine
- VectorVest Options Analyzer
- VectorVest ProGraphics v6.0
- VectorVest ProTrader 7
- VectorVest RealTime Derby Tool
- VectorVest Simulator
- VectorVest Variator
- VectorVest Watchdog
